IB Chemistry Standard Level

This subject is broken down into 55 topics in 15 modules:

  1. Stoichiometric relationships 3 topics
  2. Atomic structure 3 topics
  3. Periodicity 2 topics
  4. Chemical bonding and structure 5 topics
  5. Energetics/thermochemistry 3 topics
  6. Chemical kinetics 1 topics
  7. Equilibrium 1 topics
  8. Acids and bases 5 topics
  9. Redox processes 2 topics
  10. Organic chemistry 2 topics
  11. Measurement and data processing 3 topics
  12. Option A: Materials 7 topics
  13. Option B: Biochemistry 7 topics
  14. Option C: Energy 5 topics
  15. Option D: Medicinal chemistry 6 topics
Study this subject in the Adapt App →
  • 15
    modules
  • 55
    topics
  • 18,707
    words of revision content
  • 2+
    hours of audio lessons

This page was last modified on 28 September 2024.

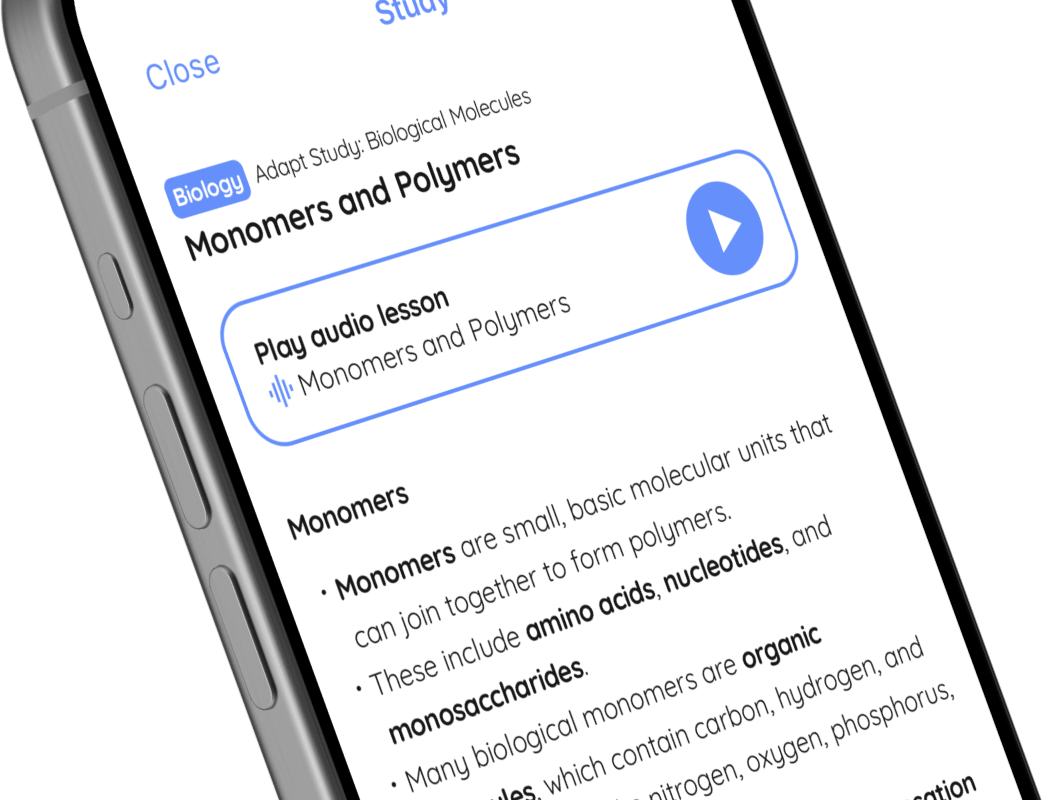
A preview of IB Chemistry Standard Level in the Adapt app

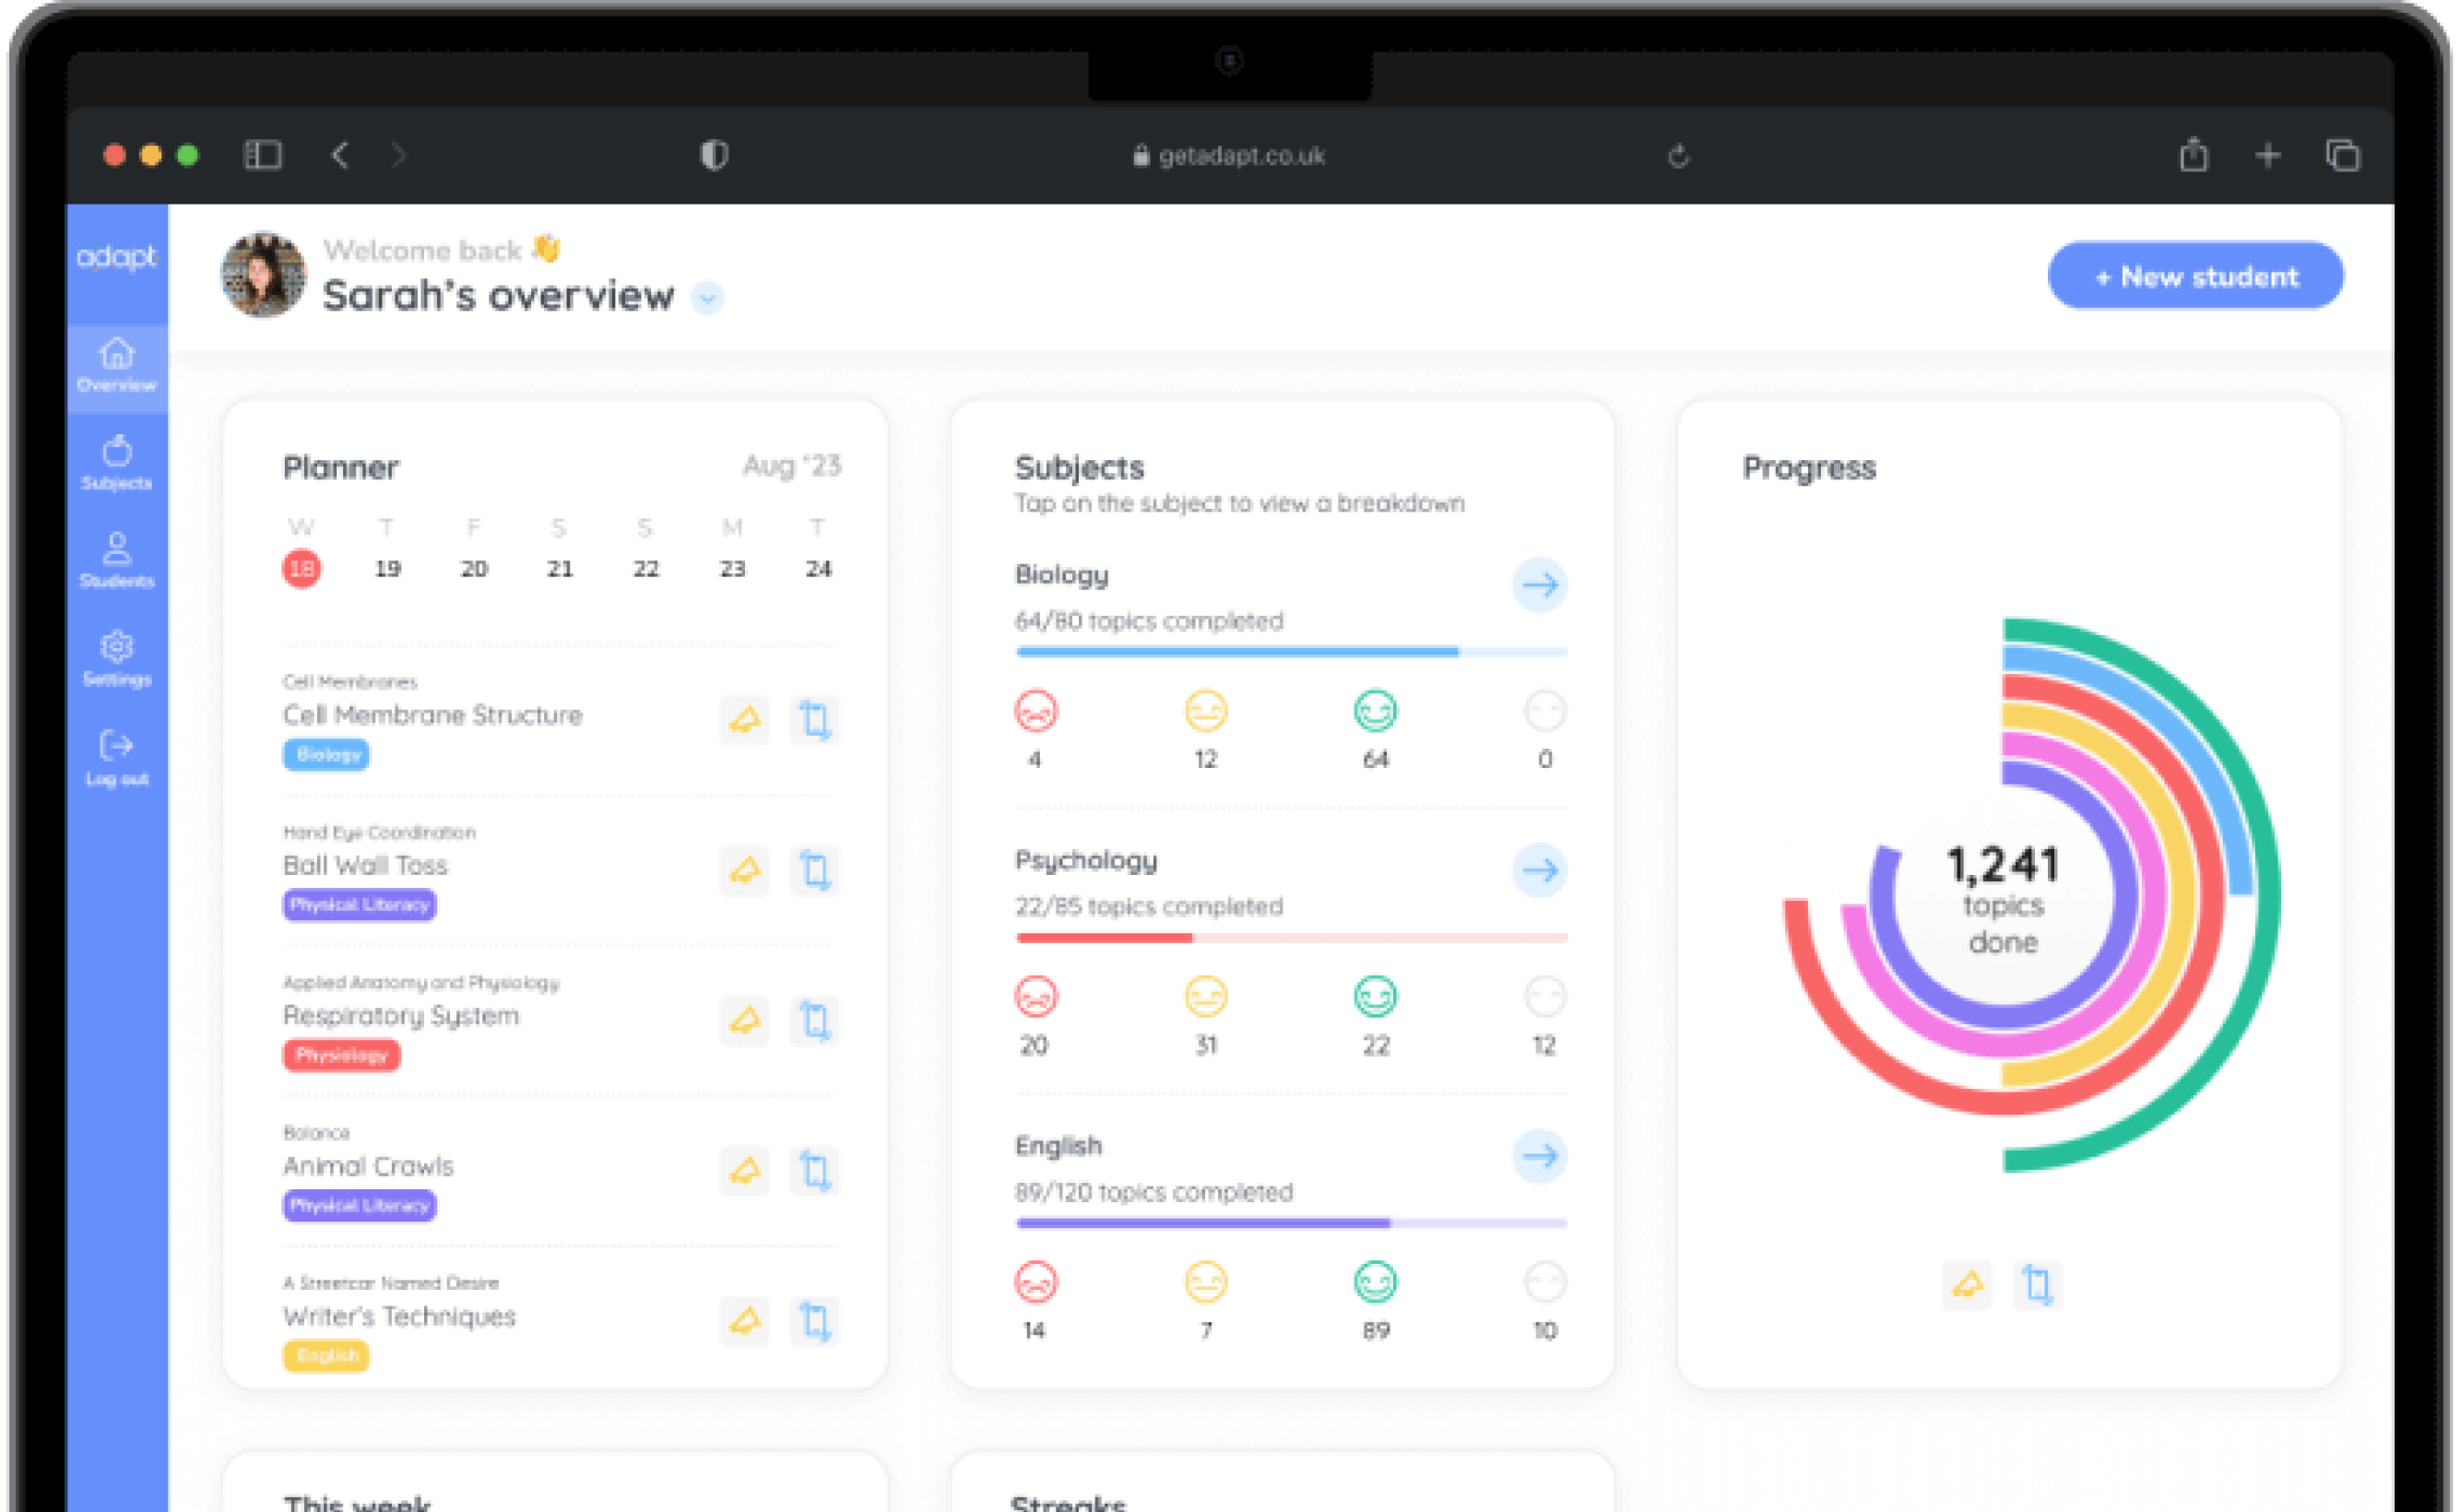
Adapt is a revision planning app with full content coverage and unlimited past paper questions for 1,200+ GCSE and A Level subjects.

Study this subject in the Adapt app →

Chemistry

Stoichiometric relationships

Introduction to the particulate nature of matter and chemical change

🤓 Study

📖 Quiz

Play audio lesson

Introduction to the particulate nature of matter and chemical change

Nature of Matter

  • Everything that has mass and occupies space is known as matter.
  • Atoms are the smallest indivisible particles of matter that take part in chemical reactions.
  • Atoms combine in different ways to form molecules which are the smallest particles of a substance that retains its identity and properties.
  • Atoms and molecules compose matter existing in three states: solids, liquids, and gases.
  • The state of matter can change due to the change in temperature and pressure, however, the chemical composition remains the same.

Molecular and Empirical Formulas

  • A molecular formula shows the actual number of atoms of each element in a molecule of a compound.
  • Empirical formula shows the simplest ratio of atoms of each element in a compound.
  • For instance, glucose has a molecular formula of C6H12O6 and an empirical formula of CH2O.

Balanced Equations and Stoichiometry

  • A chemical equation represents a chemical reaction where the reactants are written on the left-hand side, the products on the right, and an arrow pointing from reactants to products.
  • Balancing an equation involves ensuring that the law of conservation of mass is satisfied, i.e., the number of atoms of each element is the same on both sides of the equation.
  • Stoichiometry deals with the calculation of quantities (in moles, mass, or volume) of reactants and products in a balanced chemical equation.

Mole Concept and Avogadro's Number

  • The mole is a unit of amount of substance in chemistry, which contains as many entities as there are in 12 grams of carbon-12, equal to Avogadro’s number.
  • Avogadro's number is 6.022 x 10^23 and is the number of atoms in one mole of any substance.
  • The mole concept allows for the calculation of amounts of substance involved in chemical change, given the molar mass and quantity in moles, mass, or volume.

Limiting Reactants

  • In a chemical reaction, the limiting reactant is the substance that is totally consumed when the reaction is 100% complete.
  • It determines the maximum amount of product that can be formed and the amount of reactant left over.
  • To identify the limiting reactant, compare the mole ratio of the amount of reactants used with the mole ratio of the balanced chemical equation.

Course material for Chemistry, module Stoichiometric relationships, topic Introduction to the particulate nature of matter and chemical change

Chemistry

Measurement and data processing

Graphical techniques

🤓 Study

📖 Quiz

Play audio lesson

Graphical techniques

Understanding Graphical Techniques

  • Graphical techniques enable the visual representation and interpretation of scientific data.
  • Plots or charts can help illustrate relationships, trends, or patterns in the data.
  • Four major types of graphs are used in chemistry: bar graphs, line graphs, pie charts, and scatter plots.

Creating Graphs

  • Determine the type of graph appropriate for the data: bar graphs are often used for categorical data, line graphs for trends over time, scatter plots for relationships between variables, and pie charts for comparison of parts to a whole.
  • Always label the x-axis (horizontal) and y-axis (vertical) appropriately with the variables they're representing.
  • Include units if applicable, and maintain consistent scales for easy interpretation.
  • Effective use of colours, legend or size can help differentiate groups or track multiple variables.

Interpretation of Graphs

  • Graphs allow for visualisation of trends and patterns that might not be evident from tables or raw data.
  • The gradient or slope of a line graph provides information about the rate of change of one variable with another.
  • Scatter plots can indicate correlation, with positive correlation shown as an upward trend and negative correlation as a downward trend.
  • Outliers are data points that are distant from the rest, and may indicate errors or unusual occurrences.

Application of Graphs in Chemistry

  • In chemistry, graphs are used in numerous applications such as tracking reaction rates, showing equilibrium shifts, or displaying the distribution of energy levels in an atom.
  • Titration curves are used to show how pH changes during titration; they can help identify the equivalence point and indicate the strength of acids or bases.
  • Phase diagrams enable visualisation of state changes as a substance is heated or cooled.

Graphical Analysis Techniques

  • Linear regression or line of best fit can help estimate the relationship between two variables in a scatter plot.
  • Analysing the residuals (differences between observed and expected values) can provide information about the fitness of the model.
  • Error bars plotted on graphs illustrate the uncertainty or variability of data.
  • Transformation of data (e.g. logarithms, square roots) may be used to linearise non-linear relationships for easier analysis.

Course material for Chemistry, module Measurement and data processing, topic Graphical techniques

Can I trust Adapt’s expertise?

Adapt is already used by over 600,000 students and trusted by over 3,000 schools. Our exam-specific content and assessments are meticulously crafted by expert teachers and examiners.

Find out more about the Adapt app →

Planner

An always up-to-date revision timetable.

A personalised, flexible revision timetable that stays up-to-date automatically.

Content

All the exam resources, in one place.

Over 20,000 topics broken down into manageable lessons with teacher-written, exam-specific lessons.

Assessment

Past-paper questions, with instant feedback.

Unlimited past paper questions with instant examiner feedback on how to improve.

Progress

Track progress, together.

Progress tracking to stay motivated, with real-time updates to the Parent Portal.

Download the app today to start revising for free.