Level 3 Statistical Problem Solving using Software WJEC

This subject is broken down into 39 topics in 8 modules:

  1. Planning and Data Collection 5 topics
  2. Data Processing and Representation 5 topics
  3. Analysing and Interpreting Data 6 topics
  4. Probability and Statistical Distributions 6 topics
  5. Statistical Hypothesis Testing 5 topics
  6. Regression Analysis 4 topics
  7. Time Series Analysis (Optional) 4 topics
  8. Index Numbers (Optional) 4 topics
Study this subject in the Adapt App →
  • 8
    modules
  • 39
    topics
  • 14,723
    words of revision content
  • 1+
    hours of audio lessons

This page was last modified on 28 September 2024.

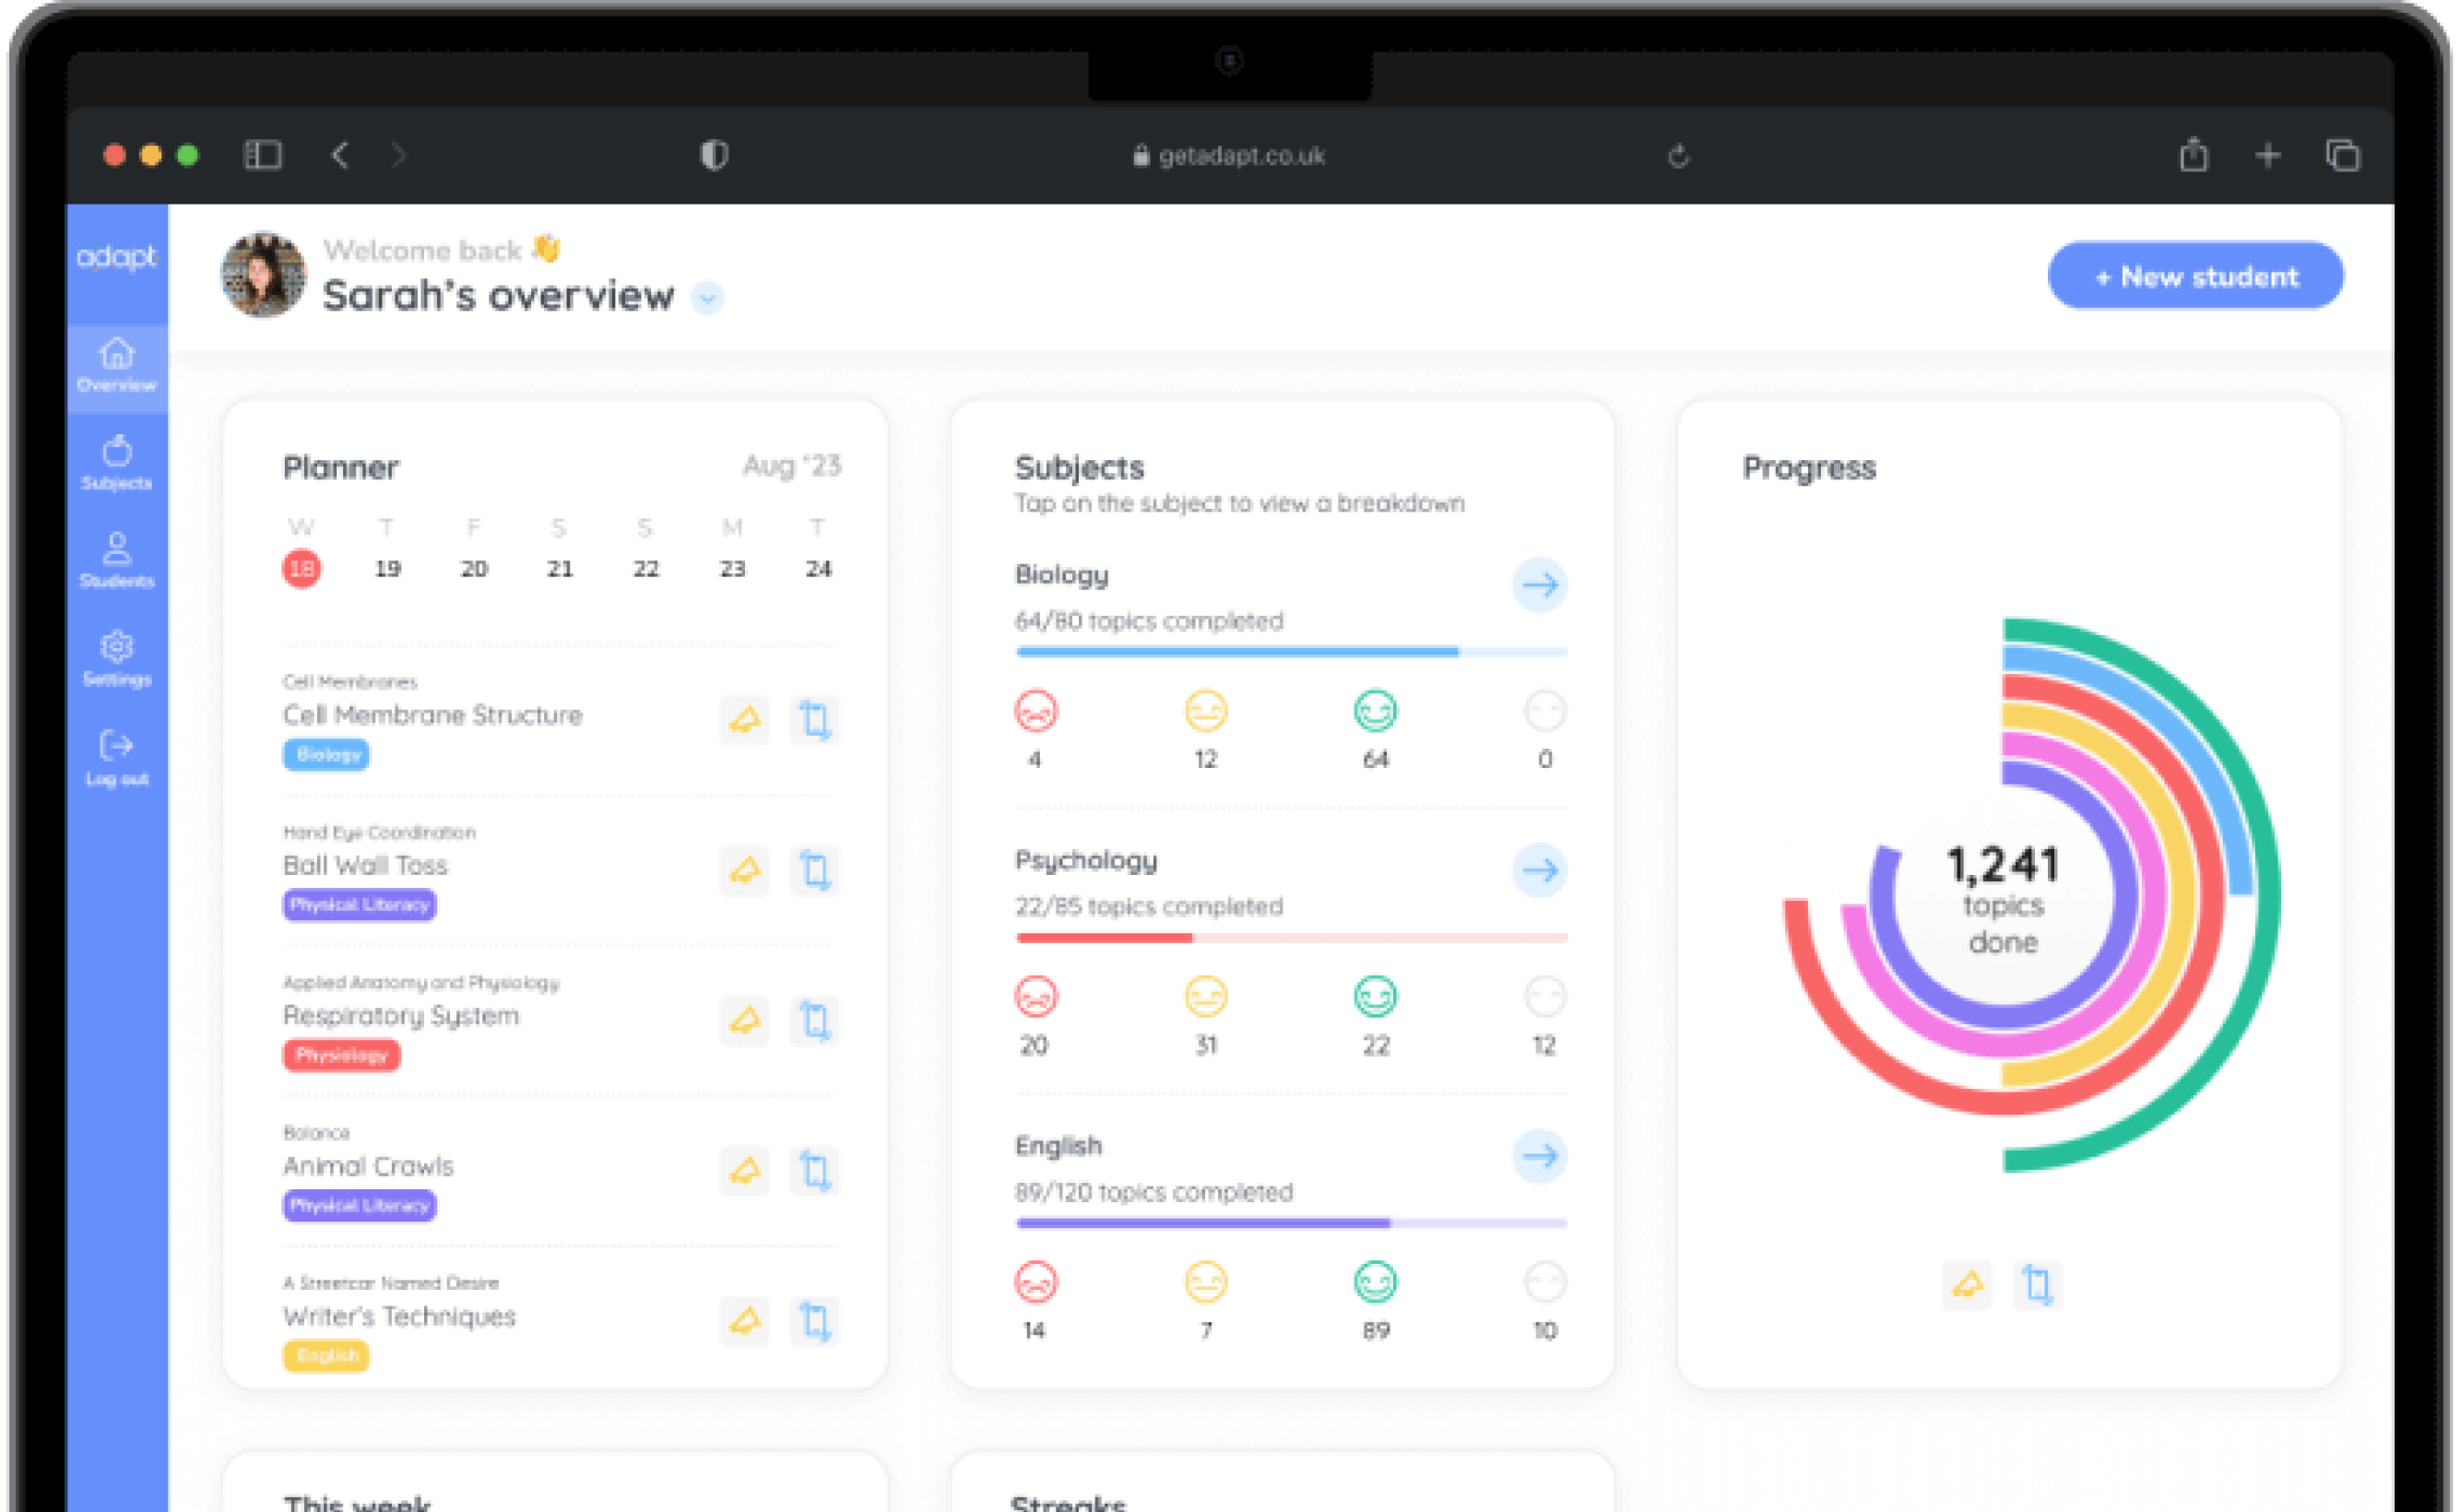
A preview of Level 3 Statistical Problem Solving using Software WJEC in the Adapt app

Adapt is a revision planning app with full content coverage and unlimited past paper questions for 1,200+ GCSE and A Level subjects.

Study this subject in the Adapt app →

Statistical Problem Solving using Software

Planning and Data Collection

Defining the Problem

🤓 Study

📖 Quiz

Play audio lesson

Defining the Problem

Defining the Problem

  • Problem Statement: This initial step involves identifying and stating the issue that needs to be addressed. The problem statement should be clear, concise, and actionable.

  • Goal Orientation: Set a clear goal that will guide the research. This goal should align directly with the problem statement. It's important to understand what you hope to achieve with your data collection and statistical analysis. This can be more easily facilitated by making the goal SMART (Specific, Measurable, Achievable, Relevant, and Time-bound).

  • Contextual Overview: Understand the wider context of the problem. This includes who is affected by the problem, and why the problem is significant. Having a broader understanding of the context can help ensure the problem is properly addressed.

  • Constraints and Assumptions: While defining the problem, consider any limitations or constraints that might impact how you collect and analyze data. These could be budgetary constraints, time constraints, or limitations on data access, for example. Additionally, any assumptions made regarding the problem need to be explicitly stated and justified.

  • Research Questions and Hypotheses: Based on the problem statement and goal, formulate specific research questions to guide the data collection. Also, form hypothetical answers or predictions about the research question, known as hypotheses.

Planning Data Collection

  • Defining Variables: Identify the different variables that relate to the problem. This could include independent variables (factors you manipulate), dependent variables (outcomes you measure), and control variables (factors you hold constant).

  • Choosing a Data Collection Method: Decide on the best method to collect data. This could include surveys, experiments, observations, or secondary data analysis. This decision should be based on the nature of the problem, available resources, and what is ethically and practically possible.

  • Sampling: Decide on your sample size and sampling method. This should reflect the population you wish to study and offer a statistically valid representation.

  • Planning for Data Quality: Put plans in place to ensure that your data will be reliable (consistent over time) and valid (measuring what it claims to measure).

Remember, the problem definition and data collection planning stages are crucial for any statistical problem solving. Take time to be thorough and thoughtful during these stages to ensure a solid foundation for your data collection and analysis.

Course material for Statistical Problem Solving using Software, module Planning and Data Collection, topic Defining the Problem

Statistical Problem Solving using Software

Probability and Statistical Distributions

Poisson Distribution

🤓 Study

📖 Quiz

Play audio lesson

Poisson Distribution

Understanding the Poisson Distribution

  • The Poisson distribution is widely used in probability theory and statistics.
  • Named after French mathematician Siméon Denis Poisson, it models discrete events over a fixed period of time or space.
  • A discrete event is one with a specific, countable outcome, such as the number of cars passing through a toll in a day.

Assumptions of The Poisson Distribution

  • The average number of events (λ, pronounced lambda) is constant.
  • The probability of more than one event happening in an infinitesimally short time interval is negligible.
  • Individual events are independent, meaning the occurrence of one event does not impact the occurrence of another.

Key Characteristics of The Poisson Distribution

  • The events are randomly occurring.
  • The mean (λ) is equal to the variance. The mean is the average rate of occurrence and the variance measures how spread out the distribution is.

Calculating Poisson Probability

  • The formula to calculate Poisson probability is P(x; λ) = e^−λ * λ^x / x! where:
    • P(x; λ) is the Poisson probability,
    • e is approximately equal to 2.71828,
    • λ is the average number of events per interval,
    • x is the actual number of successes,
    • x! is the factorial of x.
  • The formula can be used to calculate the probability of occurrence for a specific number of events.

Example of Poisson Distribution

  • An example of Poisson distribution could be predicting the number of calls to a help centre in a day, given that the average number of daily calls is known.

Using Software in The Poisson Distribution

  • Software packages, such as Microsoft Excel, Python and R, are often used to solve complex questions involving the Poisson distribution.
  • Using these tools, you can input your known λ and expected x values to get your probabilities, rather than calculating by hand.
  • These tools are not just time saving but also offer greater accuracy in calculations, especially when dealing with large datasets.

Course material for Statistical Problem Solving using Software, module Probability and Statistical Distributions, topic Poisson Distribution

Can I trust Adapt’s expertise?

Adapt is already used by over 600,000 students and trusted by over 3,000 schools. Our exam-specific content and assessments are meticulously crafted by expert teachers and examiners.

Find out more about the Adapt app →

Planner

An always up-to-date revision timetable.

A personalised, flexible revision timetable that stays up-to-date automatically.

Content

All the exam resources, in one place.

Over 20,000 topics broken down into manageable lessons with teacher-written, exam-specific lessons.

Assessment

Past-paper questions, with instant feedback.

Unlimited past paper questions with instant examiner feedback on how to improve.

Progress

Track progress, together.

Progress tracking to stay motivated, with real-time updates to the Parent Portal.

Download the app today to start revising for free.