GCSE Mathematics (Higher) AQA

This subject is broken down into 158 topics in 13 modules:

  1. Angles, lines and polygons 15 topics
  2. Bounds 15 topics
  3. Circle theorems 12 topics
  4. Higher 10 topics
  5. Percentages 16 topics
  6. Surds 12 topics
  7. Algebra 18 topics
  8. Graphs 13 topics
  9. Ratio, Proportions and Rates of Change 6 topics
  10. Geometry and Measures 17 topics
  11. Pythagoras and Trigonometry 7 topics
  12. Probability and Statistics 17 topics
  13. Vectors 0 topics
Study this subject in the Adapt App →
  • 13
    modules
  • 158
    topics
  • 55,724
    words of revision content
  • 7+
    hours of audio lessons

This page was last modified on 9 January 2025.

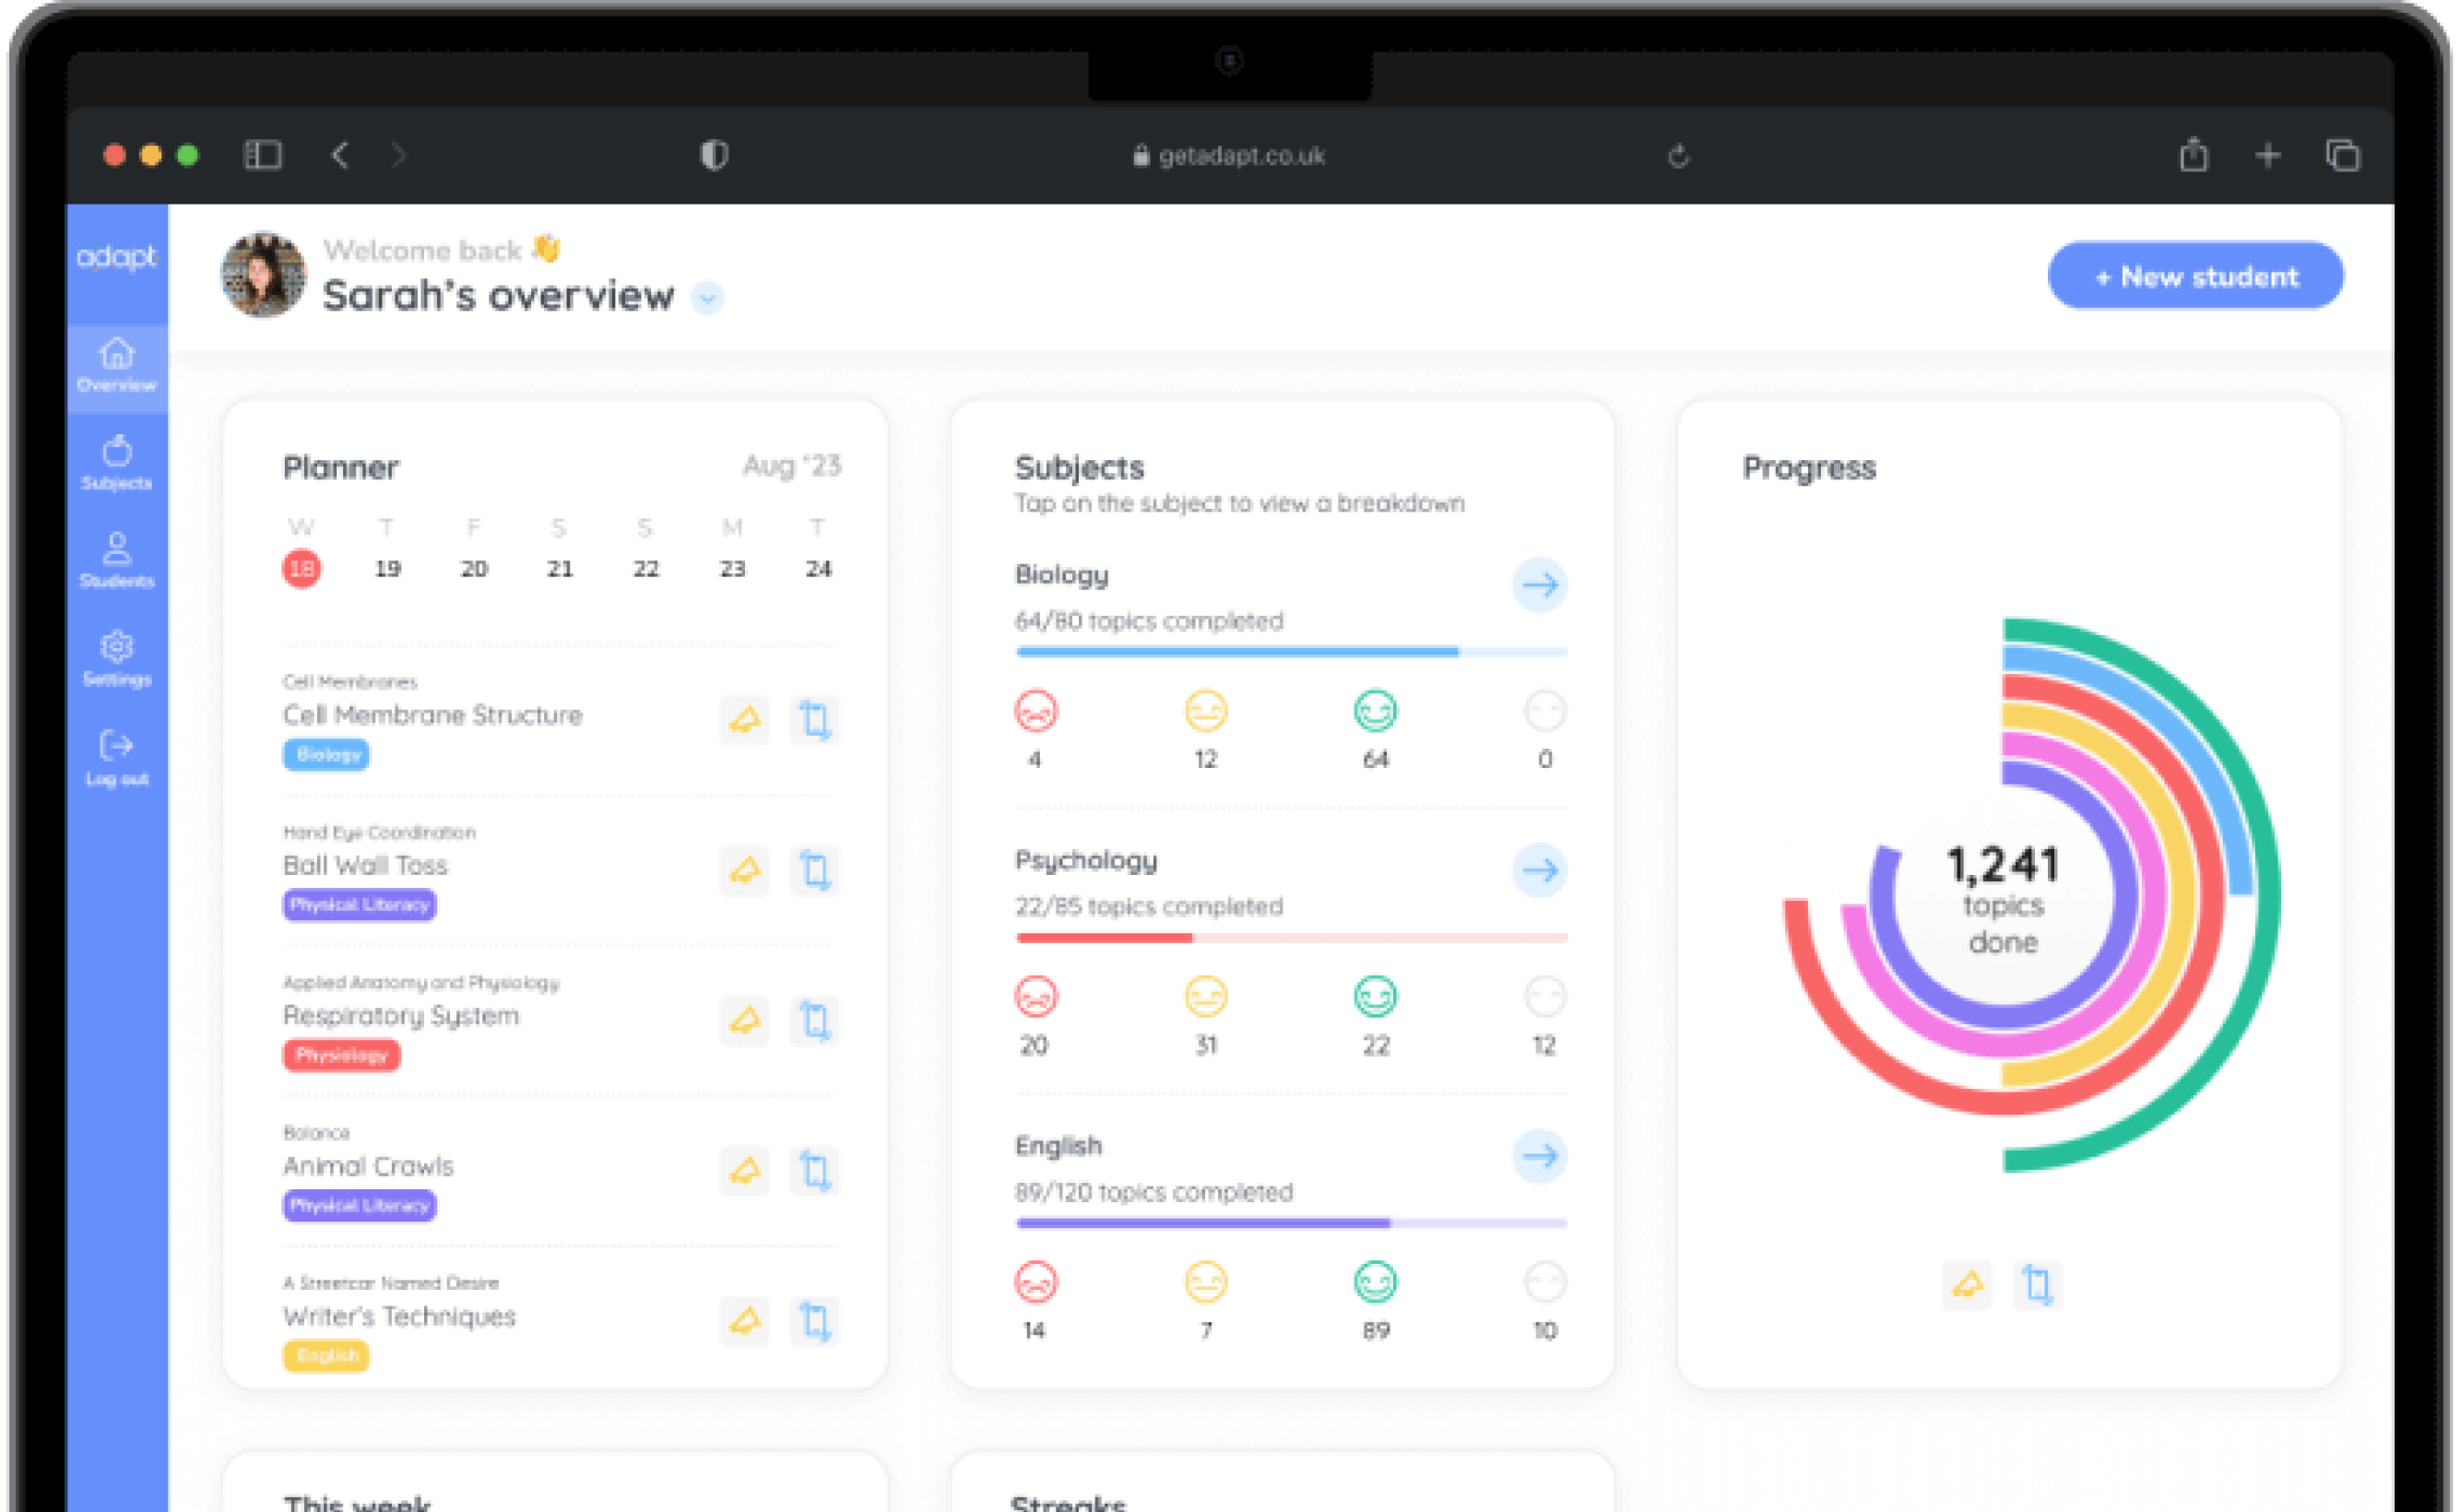
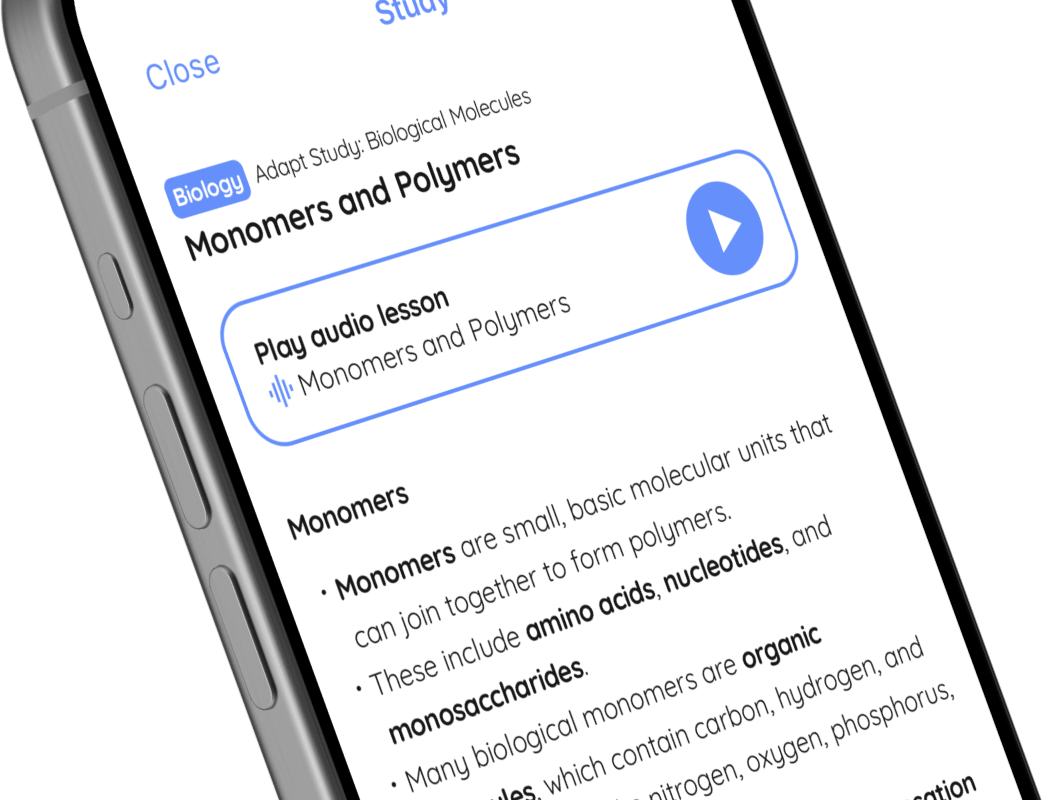
A preview of GCSE Mathematics (Higher) AQA in the Adapt app

Adapt is a revision planning app with full content coverage and unlimited past paper questions for 1,200+ GCSE and A Level subjects.

Study this subject in the Adapt app →

Mathematics (Higher)

Angles, lines and polygons

Basics of Angles - Acute, Obtuse, Right, Straight, Reflex

🤓 Study

📖 Quiz

Play audio lesson

Basics of Angles - Acute, Obtuse, Right, Straight, Reflex

Basics of Angles

  • An angle is formed by two lines that start from the same point. The space between these lines is measured in degrees.

  • A full angle measures 360 degrees. This represents a total rotation around a point.

Acute Angles

  • An acute angle is an angle that measures less than 90 degrees but more than 0 degrees.

Right Angles

  • A right angle measures exactly 90 degrees.
  • It is often denoted by a small square in the corner at the point of the angle.

Obtuse Angles

  • An obtuse angle is larger than 90 degrees but less than 180 degrees.

Straight Angles

  • A straight angle measures exactly 180 degrees. .
  • This forms a straight line.

Reflex Angles

  • A reflex angle measures more than 180 degrees but less than 360 degrees.

Remember that understanding the different types of angles is fundamental to then working with more complex geometrical figures such as triangles, quadrilaterals and polygons. Make sure to practice identifying and working with different types of angles.

Course material for Mathematics (Higher), module Angles, lines and polygons, topic Basics of Angles - Acute, Obtuse, Right, Straight, Reflex

Mathematics (Higher)

Percentages

Using Percentages in Data Interpretation

🤓 Study

📖 Quiz

Play audio lesson

Using Percentages in Data Interpretation

Using Percentages in Data Interpretation

  • Data interpretation frequently involves the use of percentages. Understanding and correctly using percentages can provide critical insights into data sets.

  • When interpreting data sets, percentages play a key role. They're commonly used to express proportionate data, making them essential in data comparison and analysis.

  • If given raw numbers, converting them into percentages can often provide a clearer view of the overall picture or data context.

  • For instance, if a data set shows that 15 out of 25 students chose a particular course, you might initially think that's a small number. However, converting this to a percentage (60%) can highlight just how significant this number is.

Comparing Data Using Percentages

  • Percentages are especially useful when trying to compare data. By converting raw numbers into percentages, it becomes easier to appreciate the different proportions or distributions in the data.

  • For example, in comparing election results or survey data among different groups, converting raw numbers into percentages can demonstrate the relative popularity or preference among groups.

  • A clear understanding of percentages can help avoid misinterpretations. For example, a group receiving 200 votes out of 1000 (20%) has less support than a group receiving 150 votes out of 500 (30%), even though the first group has more votes in raw numbers.

Percentages Change over Time

  • When analysing data over time, the use of percentages can show percentage change, which is a measure of the relative difference between the initial data point and the final one.

  • The formula for percentage change is ((New Value - Original Value) / Original Value) * 100. This formula calculates the relative change in terms of the original value.

  • This calculation is crucial in data interpretation, as it depicts how data has developed over time, which might not be immediately clear just from raw numbers.

Interpreting Percentages in Likelihood or Probability

  • Percentages are also used to interpret likelihood or probability in statistics.

  • Likelihood can be defined as the chance or probability of a certain event happening, expressed as a percentage. For example, if tossing a coin, the probability of it landing on heads is 50%.

  • Understanding the use of percentages in likelihood both solidifies your understanding of percentages and allows you to make informed decisions or analyses based on likelihood or probability.

Handling Data Interpretation Questions

  • Brushing up on your percentage skills is vital for tackling data interpretation questions, which can often appear in maths and statistics tasks.

  • Practice answering these questions and interpreting the results in terms of percentages. This practice will help you understand the underlying themes and subtleties within the data, potentially leading to more accurate and insightful conclusions.

  • Constantly relate your mathematical knowledge to real-world situations. This connection will enhance your understanding and long-term retention of these key skills.

Course material for Mathematics (Higher), module Percentages, topic Using Percentages in Data Interpretation

Can I trust Adapt’s expertise?

Adapt is already used by over 600,000 students and trusted by over 3,000 schools. Our exam-specific content and assessments are meticulously crafted by expert teachers and examiners. To date, 31,625 students have studied for their GCSE Mathematics (Higher) AQA exams on the Adapt App.

Find out more about the Adapt app →

Planner

An always up-to-date revision timetable.

A personalised, flexible revision timetable that stays up-to-date automatically.

Content

All the exam resources, in one place.

Over 20,000 topics broken down into manageable lessons with teacher-written, exam-specific lessons.

Assessment

Past-paper questions, with instant feedback.

Unlimited past paper questions with instant examiner feedback on how to improve.

Progress

Track progress, together.

Progress tracking to stay motivated, with real-time updates to the Parent Portal.

Download the app today to start revising for free.