GCSE Statistics AQA

This subject is broken down into 32 topics in 4 modules:

  1. Collection and Representation of Data 12 topics
  2. Measures of Central Tendency and Dispersion 5 topics
  3. Probability and Probability Distributions 9 topics
  4. Hypothesis Testing and Confidence Intervals 6 topics
Study this subject in the Adapt App →
  • 4
    modules
  • 32
    topics
  • 11,960
    words of revision content
  • 1+
    hours of audio lessons

This page was last modified on 28 September 2024.

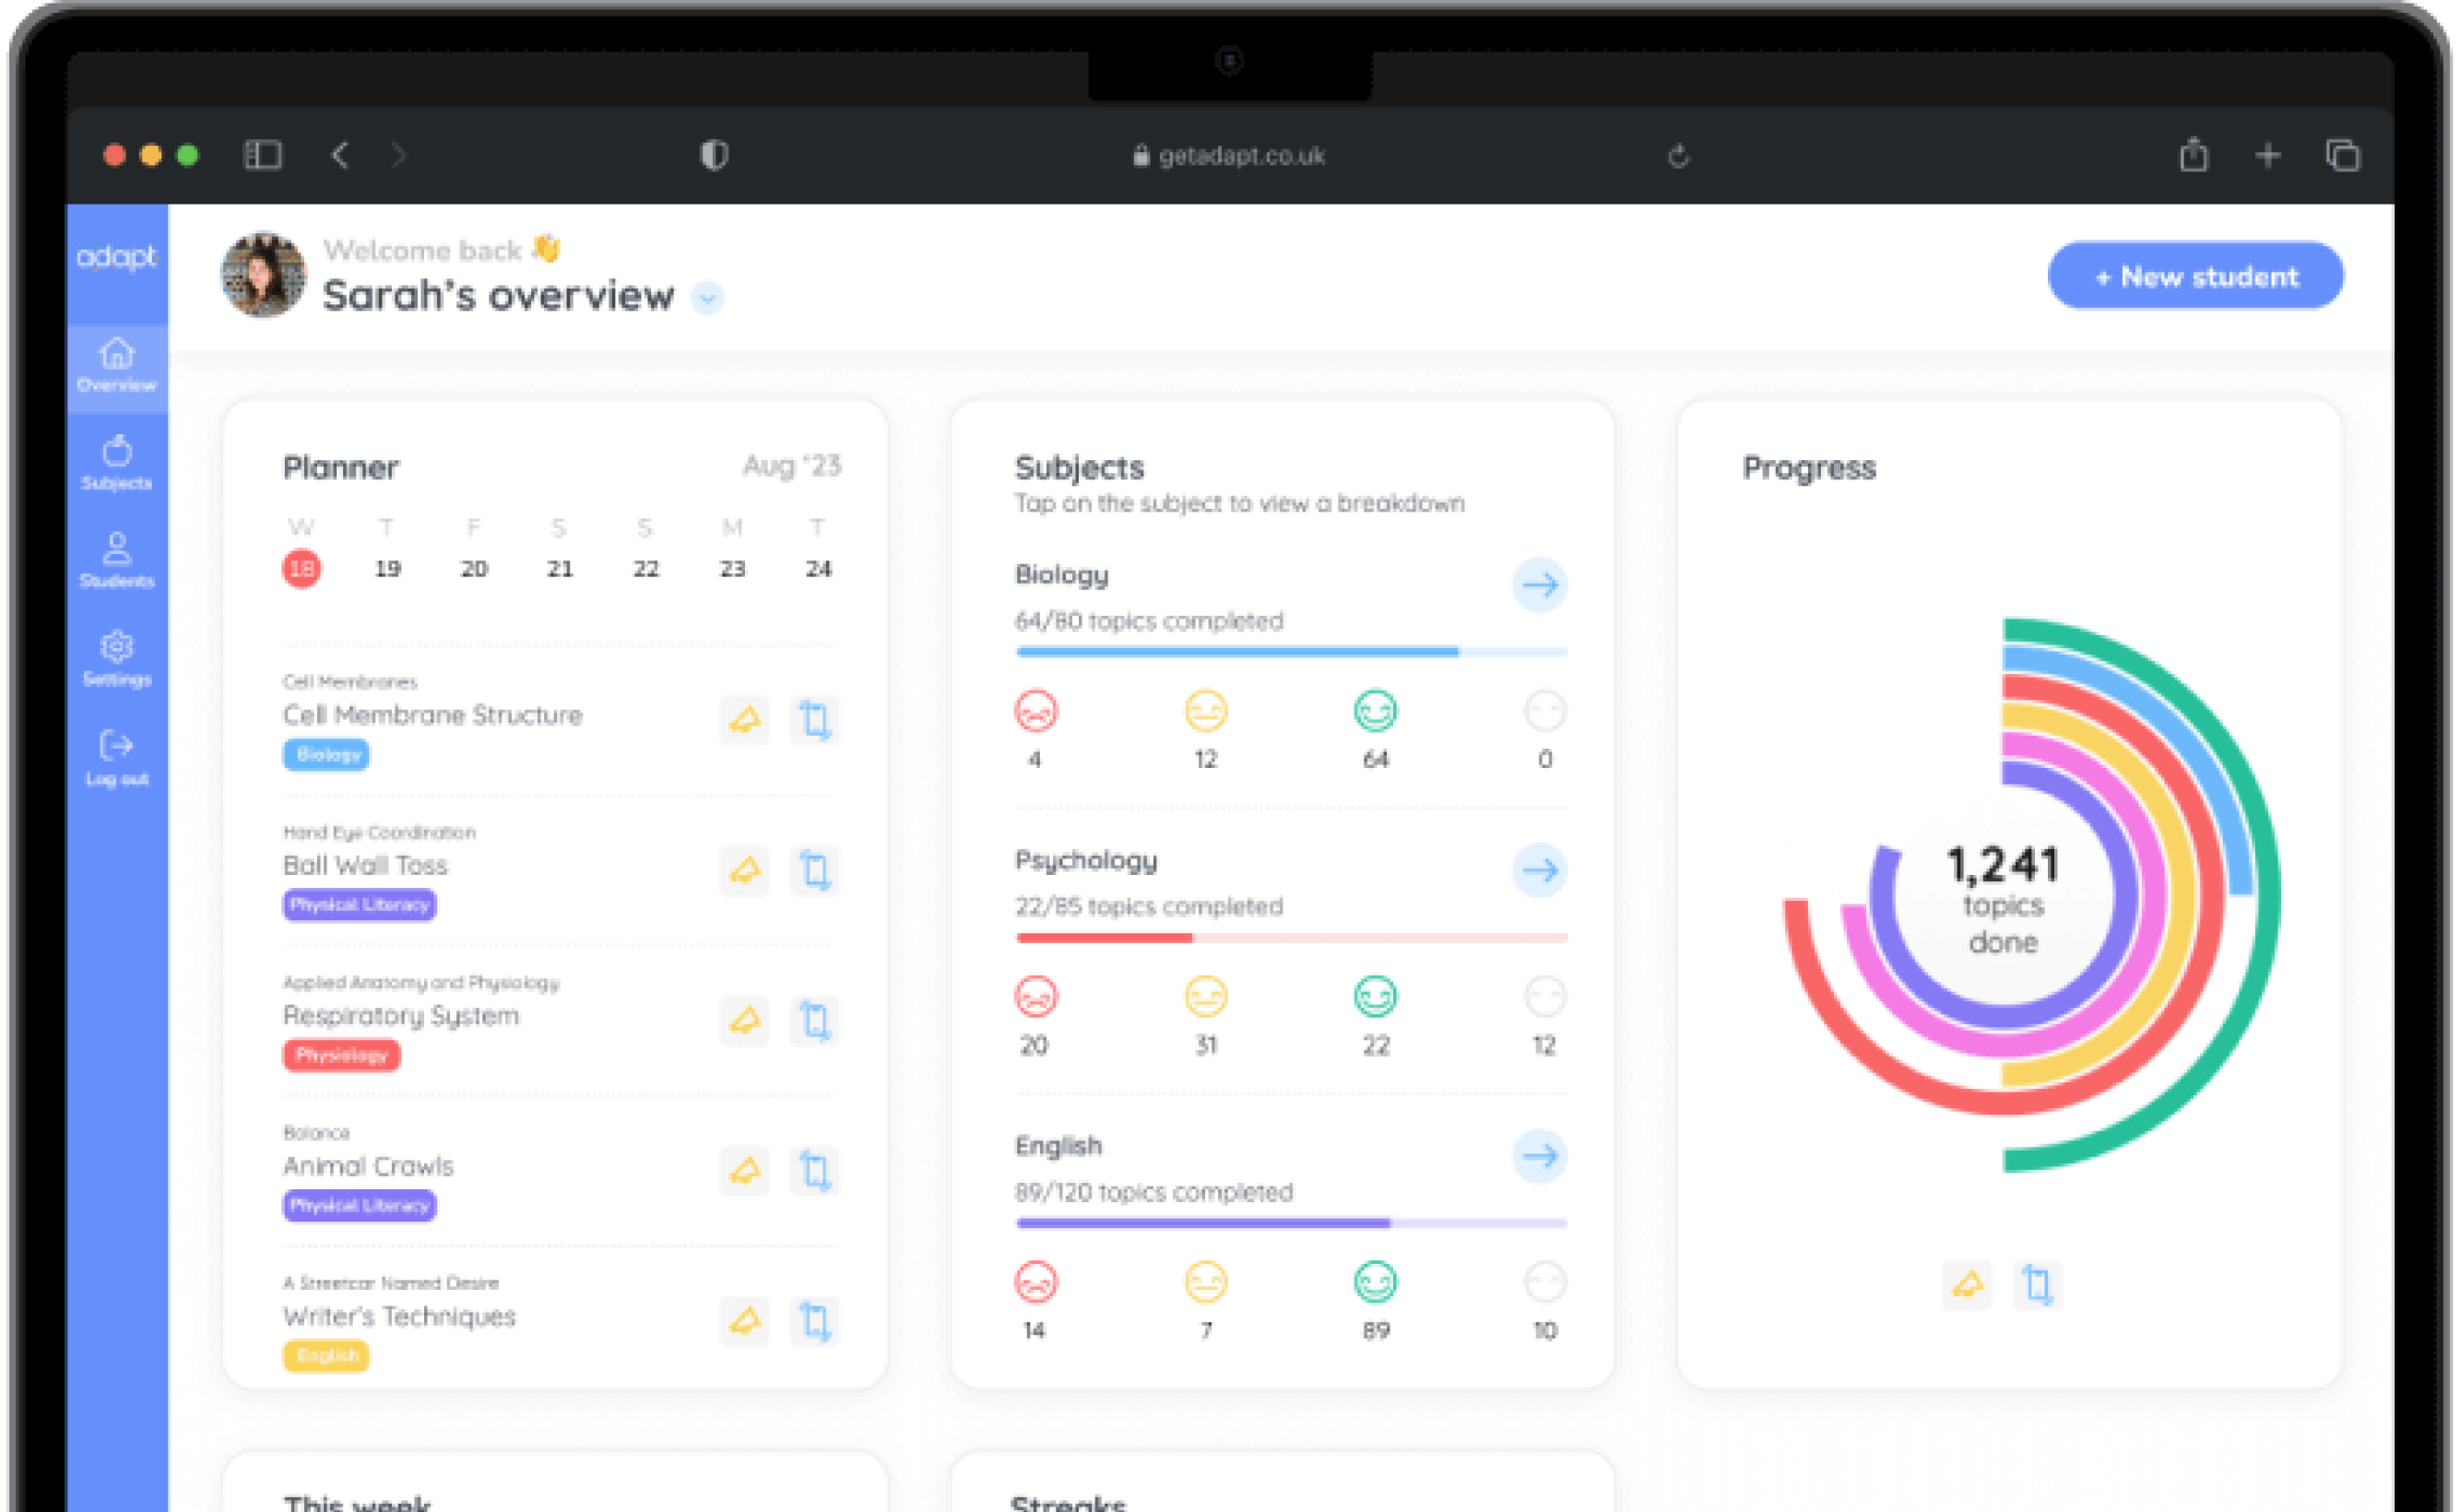
A preview of GCSE Statistics AQA in the Adapt app

Adapt is a revision planning app with full content coverage and unlimited past paper questions for 1,200+ GCSE and A Level subjects.

Study this subject in the Adapt app →

Statistics

Collection and Representation of Data

Planning a statistical enquiry

🤓 Study

📖 Quiz

Play audio lesson

Planning a statistical enquiry

Planning a Statistical Enquiry

Defining the Problem

  • Define the problem or question that the statistical enquiry will aim to answer.
  • Identify the target population for the enquiry.
  • Outline the aims and objectives of the investigation.

Constructing a Plan

  • Decide on a method of data collection that can help address the enquiry. This can be a survey, experiment, observational study, etc.
  • Choose sampling techniques appropriate for the population, considering factors such as bias and reliability.
  • Specify the hypothesis to be investigated.

Designing an Instrument

  • Design data collection instruments such as questionnaires or observational checklists.
  • Ensure the instrument is valid and reliable, and it measures what is intended to.
  • Use measurements that are understandable and relatable to the target population.

Conducting the Enquiry

  • Implement the data collection plan in the field, ensuring ethical considerations are met.
  • Monitor the process to ensure it aligns with the planned methodology.

Analysing and Interpreting the Results

  • Use appropriate statistical techniques for analysing the gathered data.
  • Interpret results with respect to the set objectives of the enquiry.
  • Consider limitations of the data and your methodology when interpreting results.

Presenting and Discussing the Findings

  • Compile the collected data into suitable graphical or tabular forms for easy interpretation.
  • Provide a summary of the findings, noting any patterns, differences or similarities seen.
  • Discuss the outcomes relating them to the original problem or enquiry.

Remember, not every statistical enquiry will follow this process exactly, but this guide provides a useful structure for most investigations.

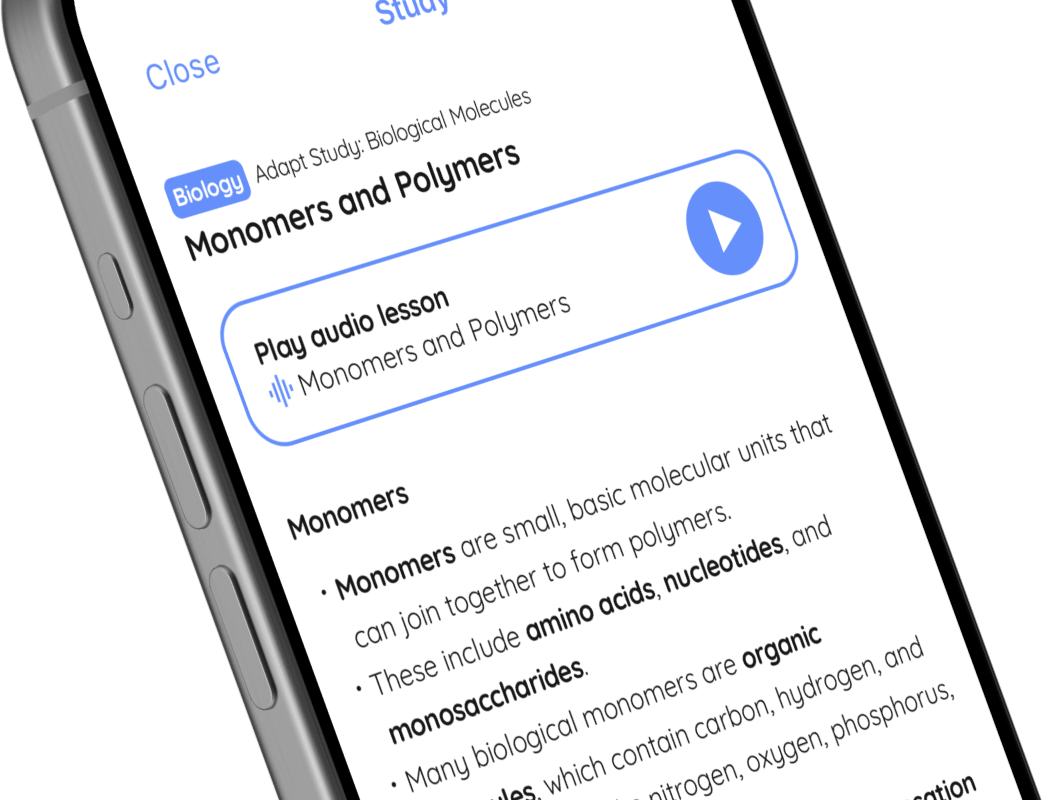
Course material for Statistics, module Collection and Representation of Data, topic Planning a statistical enquiry

Statistics

Measures of Central Tendency and Dispersion

Data interpretation and errors

🤓 Study

📖 Quiz

Play audio lesson

Data interpretation and errors

DATA INTERPRETATION

  • Data interpretation involves drawing conclusions, making predictions, and understanding data trends from given datasets.
  • Utilising our knowledge of measures of central tendency (mean, median, and mode) and measures of dispersion (range, interquartile range, variance, and standard deviation), we can interpret data more effectively.
  • Interpretation must always consider the context of data. The same dataset could be interpreted differently depending on the scenario or the research question.

ANOMALIES & ERRORS IN DATA

  • Anomalies, or outliers, are extreme values that deviate significantly from other observations in a dataset. These may be errors or valid extreme values.
  • Outliers can significantly affect our statistics, particularly the mean and range.
  • They can be detected by using interquartile range (IQR) and box plots.

BIAS AND SAMPLING ERRORS

  • Bias in statistics is a systematic distortion of a statistical analysis due to the sample selection.
  • It can cause our measures of central tendency and dispersion to be misleading.
  • The goal of sampling is to select a sample that represents the population. Errors can occur if the sample is not representative.
  • Sampling errors can be reduced through appropriate selection methods such as random, systematic, stratified, or quota sampling.

MEASUREMENT ERRORS

  • Measurement errors occur when the method of gathering measurement data is inaccurate.
  • Precision and accuracy are key in data collection. Inaccurate measurements can distort the results and interpretation of data.
  • To ensure reliability, repeated measurements are often made. Large variances in repeated measures can indicate a high level of measurement error.

DATA CLEANING

  • Errors in data can be corrected through a process called data cleaning.
  • This process involves correcting or removing erroneous data points from a dataset.
  • Data cleaning can improve the quality of the dataset and make the statistical analysis more valid and reliable.
  • During cleaning, we might decide to remove outliers, deal with missing values, or correct inconsistent or incorrectly entered data.

Remember: Errors and bias can significantly affect the interpretation of data. Always check your data thoroughly and use suitable data analyses depending on the nature and context of the data.

Course material for Statistics, module Measures of Central Tendency and Dispersion, topic Data interpretation and errors

Can I trust Adapt’s expertise?

Adapt is already used by over 600,000 students and trusted by over 3,000 schools. Our exam-specific content and assessments are meticulously crafted by expert teachers and examiners.

Find out more about the Adapt app →

Planner

An always up-to-date revision timetable.

A personalised, flexible revision timetable that stays up-to-date automatically.

Content

All the exam resources, in one place.

Over 20,000 topics broken down into manageable lessons with teacher-written, exam-specific lessons.

Assessment

Past-paper questions, with instant feedback.

Unlimited past paper questions with instant examiner feedback on how to improve.

Progress

Track progress, together.

Progress tracking to stay motivated, with real-time updates to the Parent Portal.

Download the app today to start revising for free.