IB Math Applications & Interpretation Standard Level

This subject is broken down into 15 topics in 5 modules:

  1. Numbers & Algebra 3 topics
  2. Functions 2 topics
  3. Geometry & Trigonometry 3 topics
  4. Statistics & Probability 5 topics
  5. Calculus 2 topics
Study this subject in the Adapt App →
  • 5
    modules
  • 15
    topics
  • 5,513
    words of revision content
  • 43+
    minutes of audio lessons

This page was last modified on 28 September 2024.

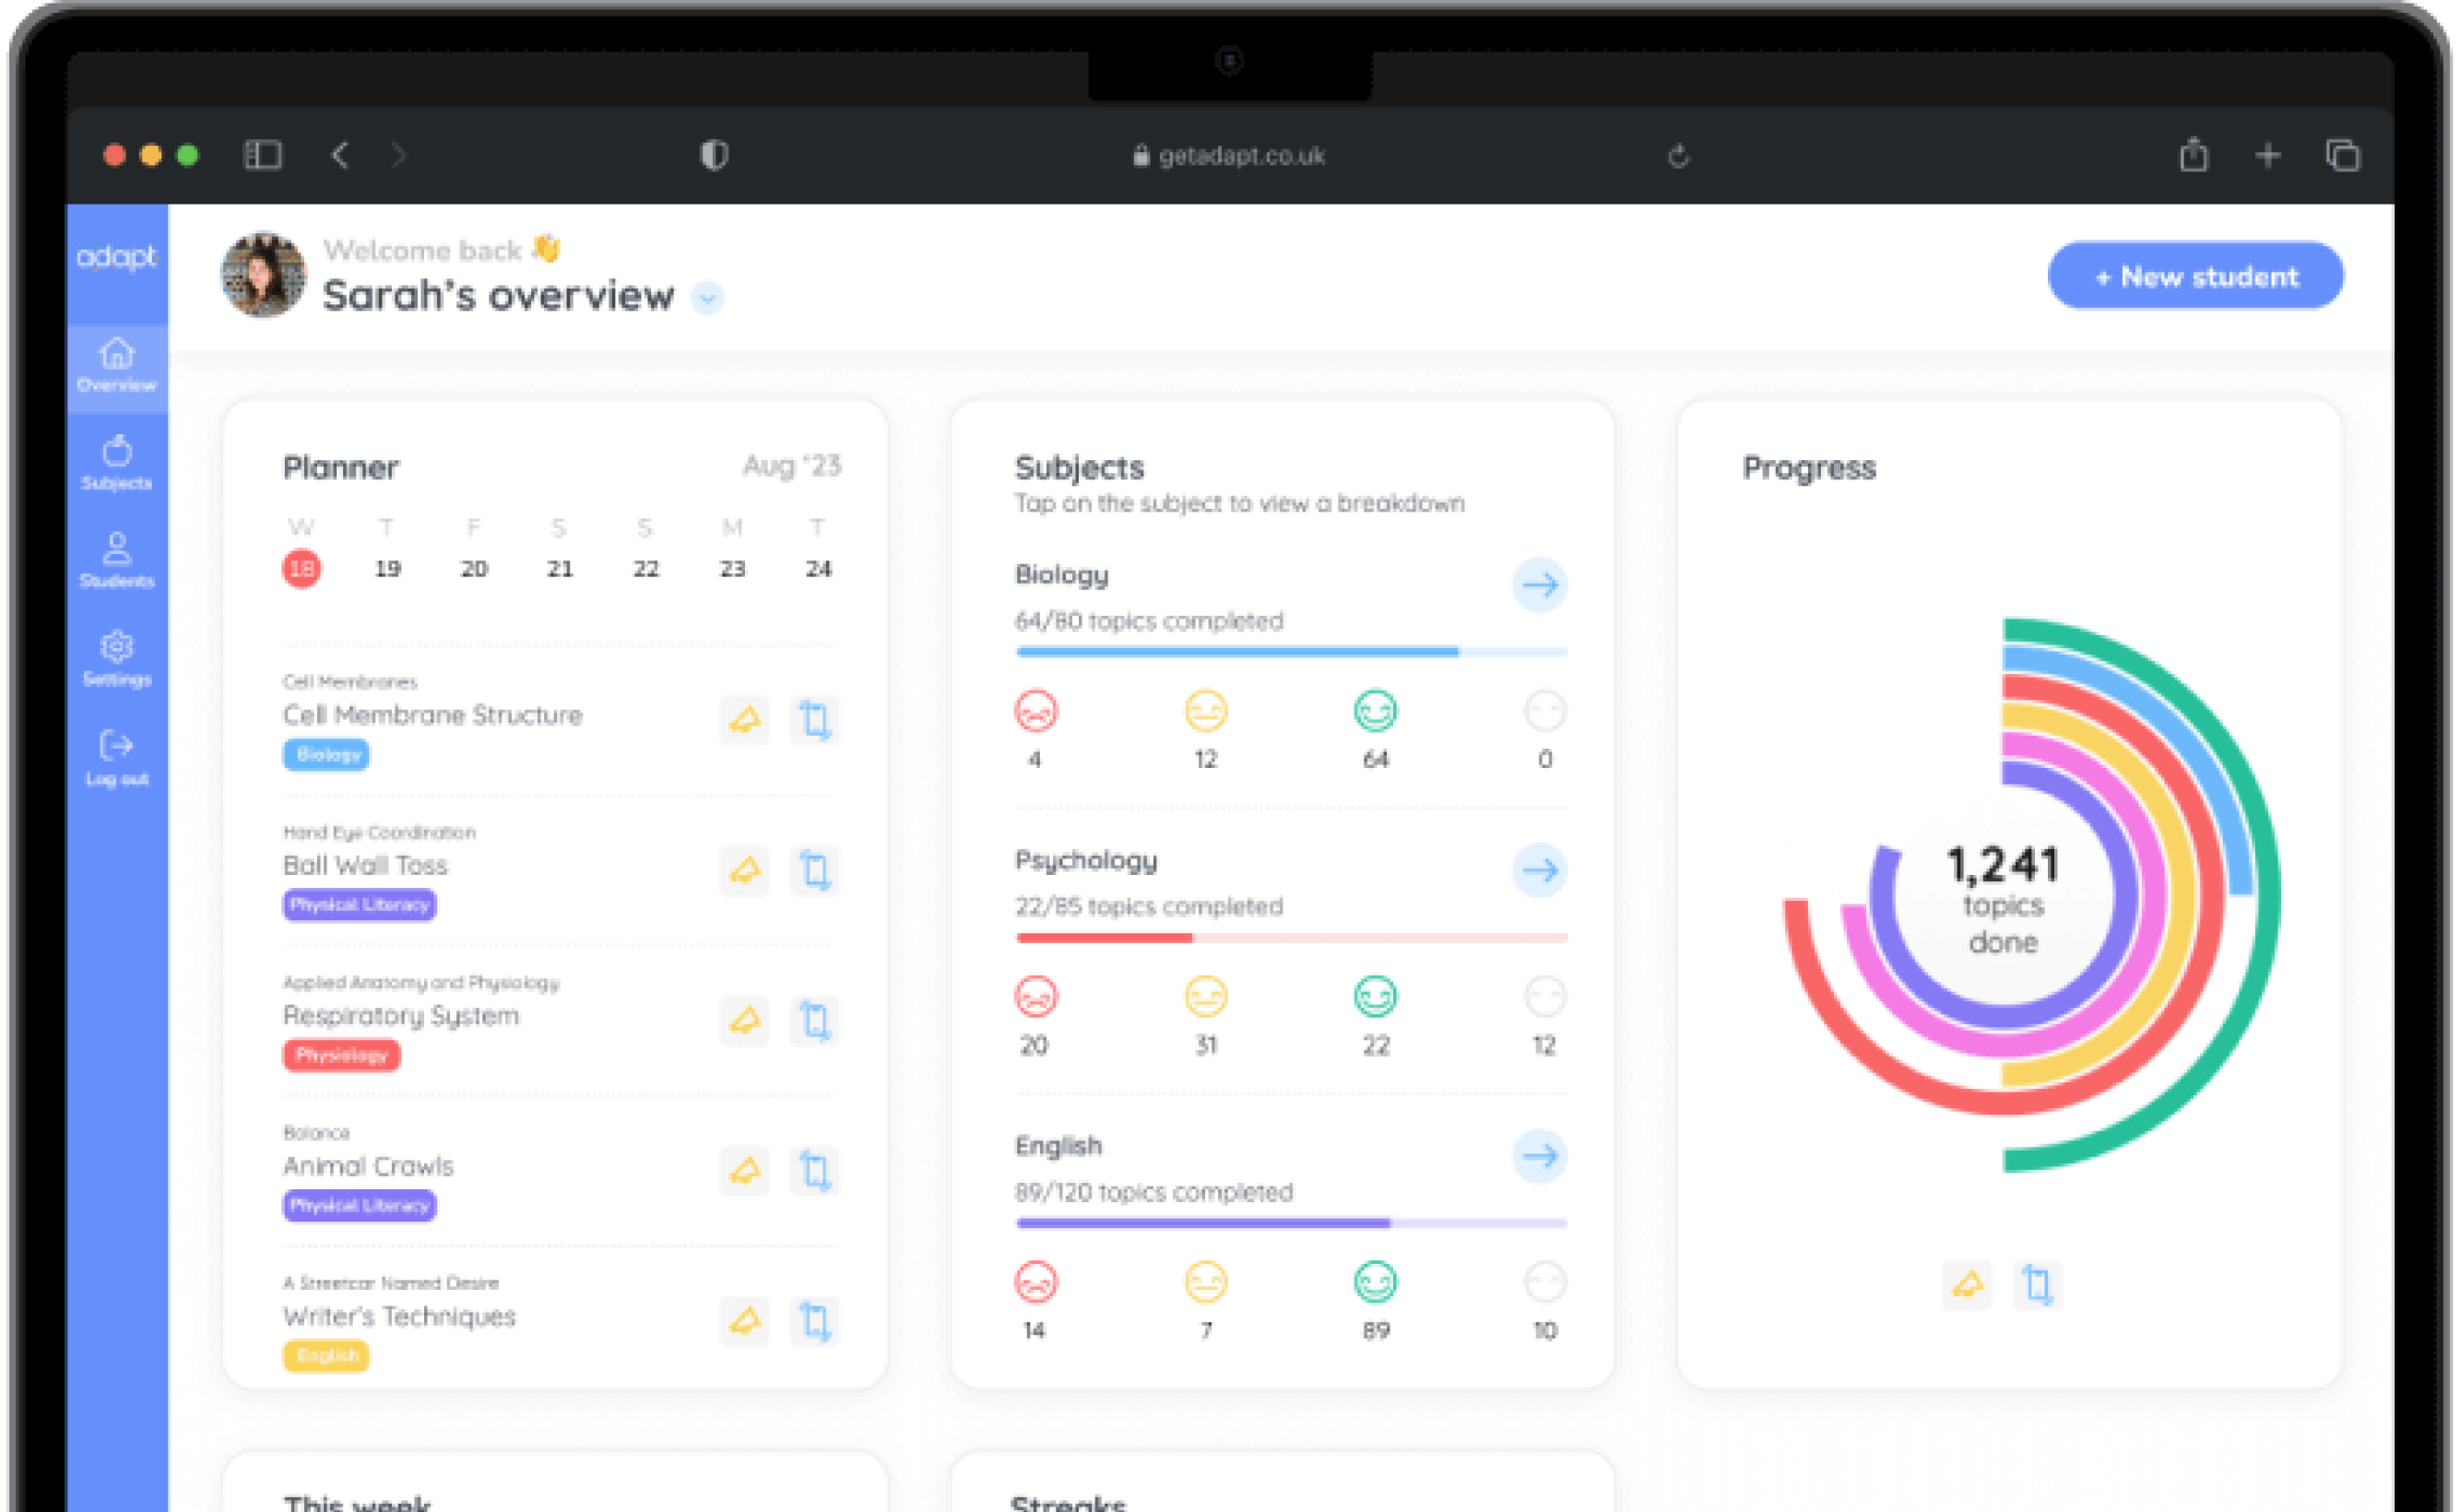
A preview of IB Math Applications & Interpretation Standard Level in the Adapt app

Adapt is a revision planning app with full content coverage and unlimited past paper questions for 1,200+ GCSE and A Level subjects.

Study this subject in the Adapt app →

Math Applications & Interpretation

Numbers & Algebra

Number Skills

🤓 Study

📖 Quiz

Play audio lesson

Number Skills

Number Skills Revision Points

Arithmetic Skills

  • Understand and utilise the order of operations (brackets, orders, division and multiplication, addition and subtraction).
  • Be able to add, subtract, multiply and divide both whole numbers and decimal numbers.
  • Accurately round numbers to a required number of decimal places or significant figures.
  • Convert between fractions, decimals and percentages.
  • Understand and identify prime numbers, and perform prime factorisation.

Number Types

  • Appreciate the differences between integers, rational numbers, irrational numbers, real numbers, and complex numbers.
  • Recognise the characteristics of odd numbers, even numbers, square numbers, and prime numbers.
  • Comprehend positive and negative numbers, including addition and subtraction.

Ratio and Proportion

  • Understand the concept of a ratio and how it differs from a fraction.
  • Convert between ratios and fractions, and simplify ratios.
  • Interpret and compute proportions using the 'cross-multiplication' method.
  • Understand and apply direct and inverse proportions in various contexts.

Percentages

  • Understand how to calculate a percentage of a whole.
  • Use percentages to describe increase, decrease and change.
  • Calculate the original amount after a percentage increase or decrease.

Number Properties

  • Understand and utilise the properties of numbers including commutative, associative, distributive, identity and inverse properties.
  • Understand the difference between an equation and an inequality.
  • Solve both linear equations and quadratic equations using a variety of methods.
  • Appreciate the value of absolute values and know how to compute them.

Sequences and Series

  • Understand the difference between arithmetic and geometric sequences.
  • Determine terms of arithmetic and geometric sequences using the nth term.
  • Recognise and apply the sum formulas for arithmetic and geometric series.

Course material for Math Applications & Interpretation, module Numbers & Algebra, topic Number Skills

Math Applications & Interpretation

Statistics & Probability

Descriptive Statistics

🤓 Study

📖 Quiz

Play audio lesson

Descriptive Statistics

Basics of Descriptive Statistics

  • Descriptive statistics provides a summary and analysis of a data collected from an experiment or study.
  • It is divided into two broad categories: measures of central tendency and measures of dispersion or variability.

Measures of Central Tendency

  • Mean: It is the average of the data set and it's calculated by adding all data points and dividing by the number of data points.
  • Median: The median is the middle value that separates the higher half from the lower half of a data set. If the data set has an even number of observations, the median is the average of the two middle numbers.
  • Mode: The mode is the value that appears most frequently in a data set.

Measures of Dispersion or Variability

  • Range: The range of a data set is the spread, which is the difference between the highest and lowest values.
  • Variance: Variance measures how far each number in the set is from the mean (or expected value).
  • Standard deviation: The standard deviation is the square root of the variance and provides a measure of the amount of variation or dispersion of a set of values.

Visual Tools for Descriptive Statistics

  • Histograms and bar graphs: These are visual representations of numerical data divided into bins or classes.
  • Box-and-whisker plots: These plots visually show the median, lower and upper quartiles, and any possible outliers in the data.
  • Scatter plots: These plots can visually display possible correlations between two different data sets.

Rules & Principles

  • Use descriptive statistics to summarize and interpret data but it does not allow you to make conclusions about the population that the data are taken from.
  • Outliers can significantly affect the mean and the standard deviation, but have less impact on the median or mode.

Importance & Relevance

  • Descriptive statistics provide clarity to large amounts of data by reducing lots of data into a simpler summary.
  • These statistics help us understand and describe the features of a specific data set, providing an informative summary of the measure.

Course material for Math Applications & Interpretation, module Statistics & Probability, topic Descriptive Statistics

Can I trust Adapt’s expertise?

Adapt is already used by over 600,000 students and trusted by over 3,000 schools. Our exam-specific content and assessments are meticulously crafted by expert teachers and examiners.

Find out more about the Adapt app →

Planner

An always up-to-date revision timetable.

A personalised, flexible revision timetable that stays up-to-date automatically.

Content

All the exam resources, in one place.

Over 20,000 topics broken down into manageable lessons with teacher-written, exam-specific lessons.

Assessment

Past-paper questions, with instant feedback.

Unlimited past paper questions with instant examiner feedback on how to improve.

Progress

Track progress, together.

Progress tracking to stay motivated, with real-time updates to the Parent Portal.

Download the app today to start revising for free.