iGCSE Mathematics CAIE

This subject is broken down into 95 topics in 6 modules:

  1. Algebra 17 topics
  2. Geometry and Measures 21 topics
  3. Graphs, Functions and Calculus 14 topics
  4. Number 18 topics
  5. Probability and Statistics 18 topics
  6. Pythagoras, Trigonometry and Vectors 7 topics
Study this subject in the Adapt App →
  • 6
    modules
  • 95
    topics
  • 34,513
    words of revision content
  • 4+
    hours of audio lessons

This page was last modified on 28 September 2024.

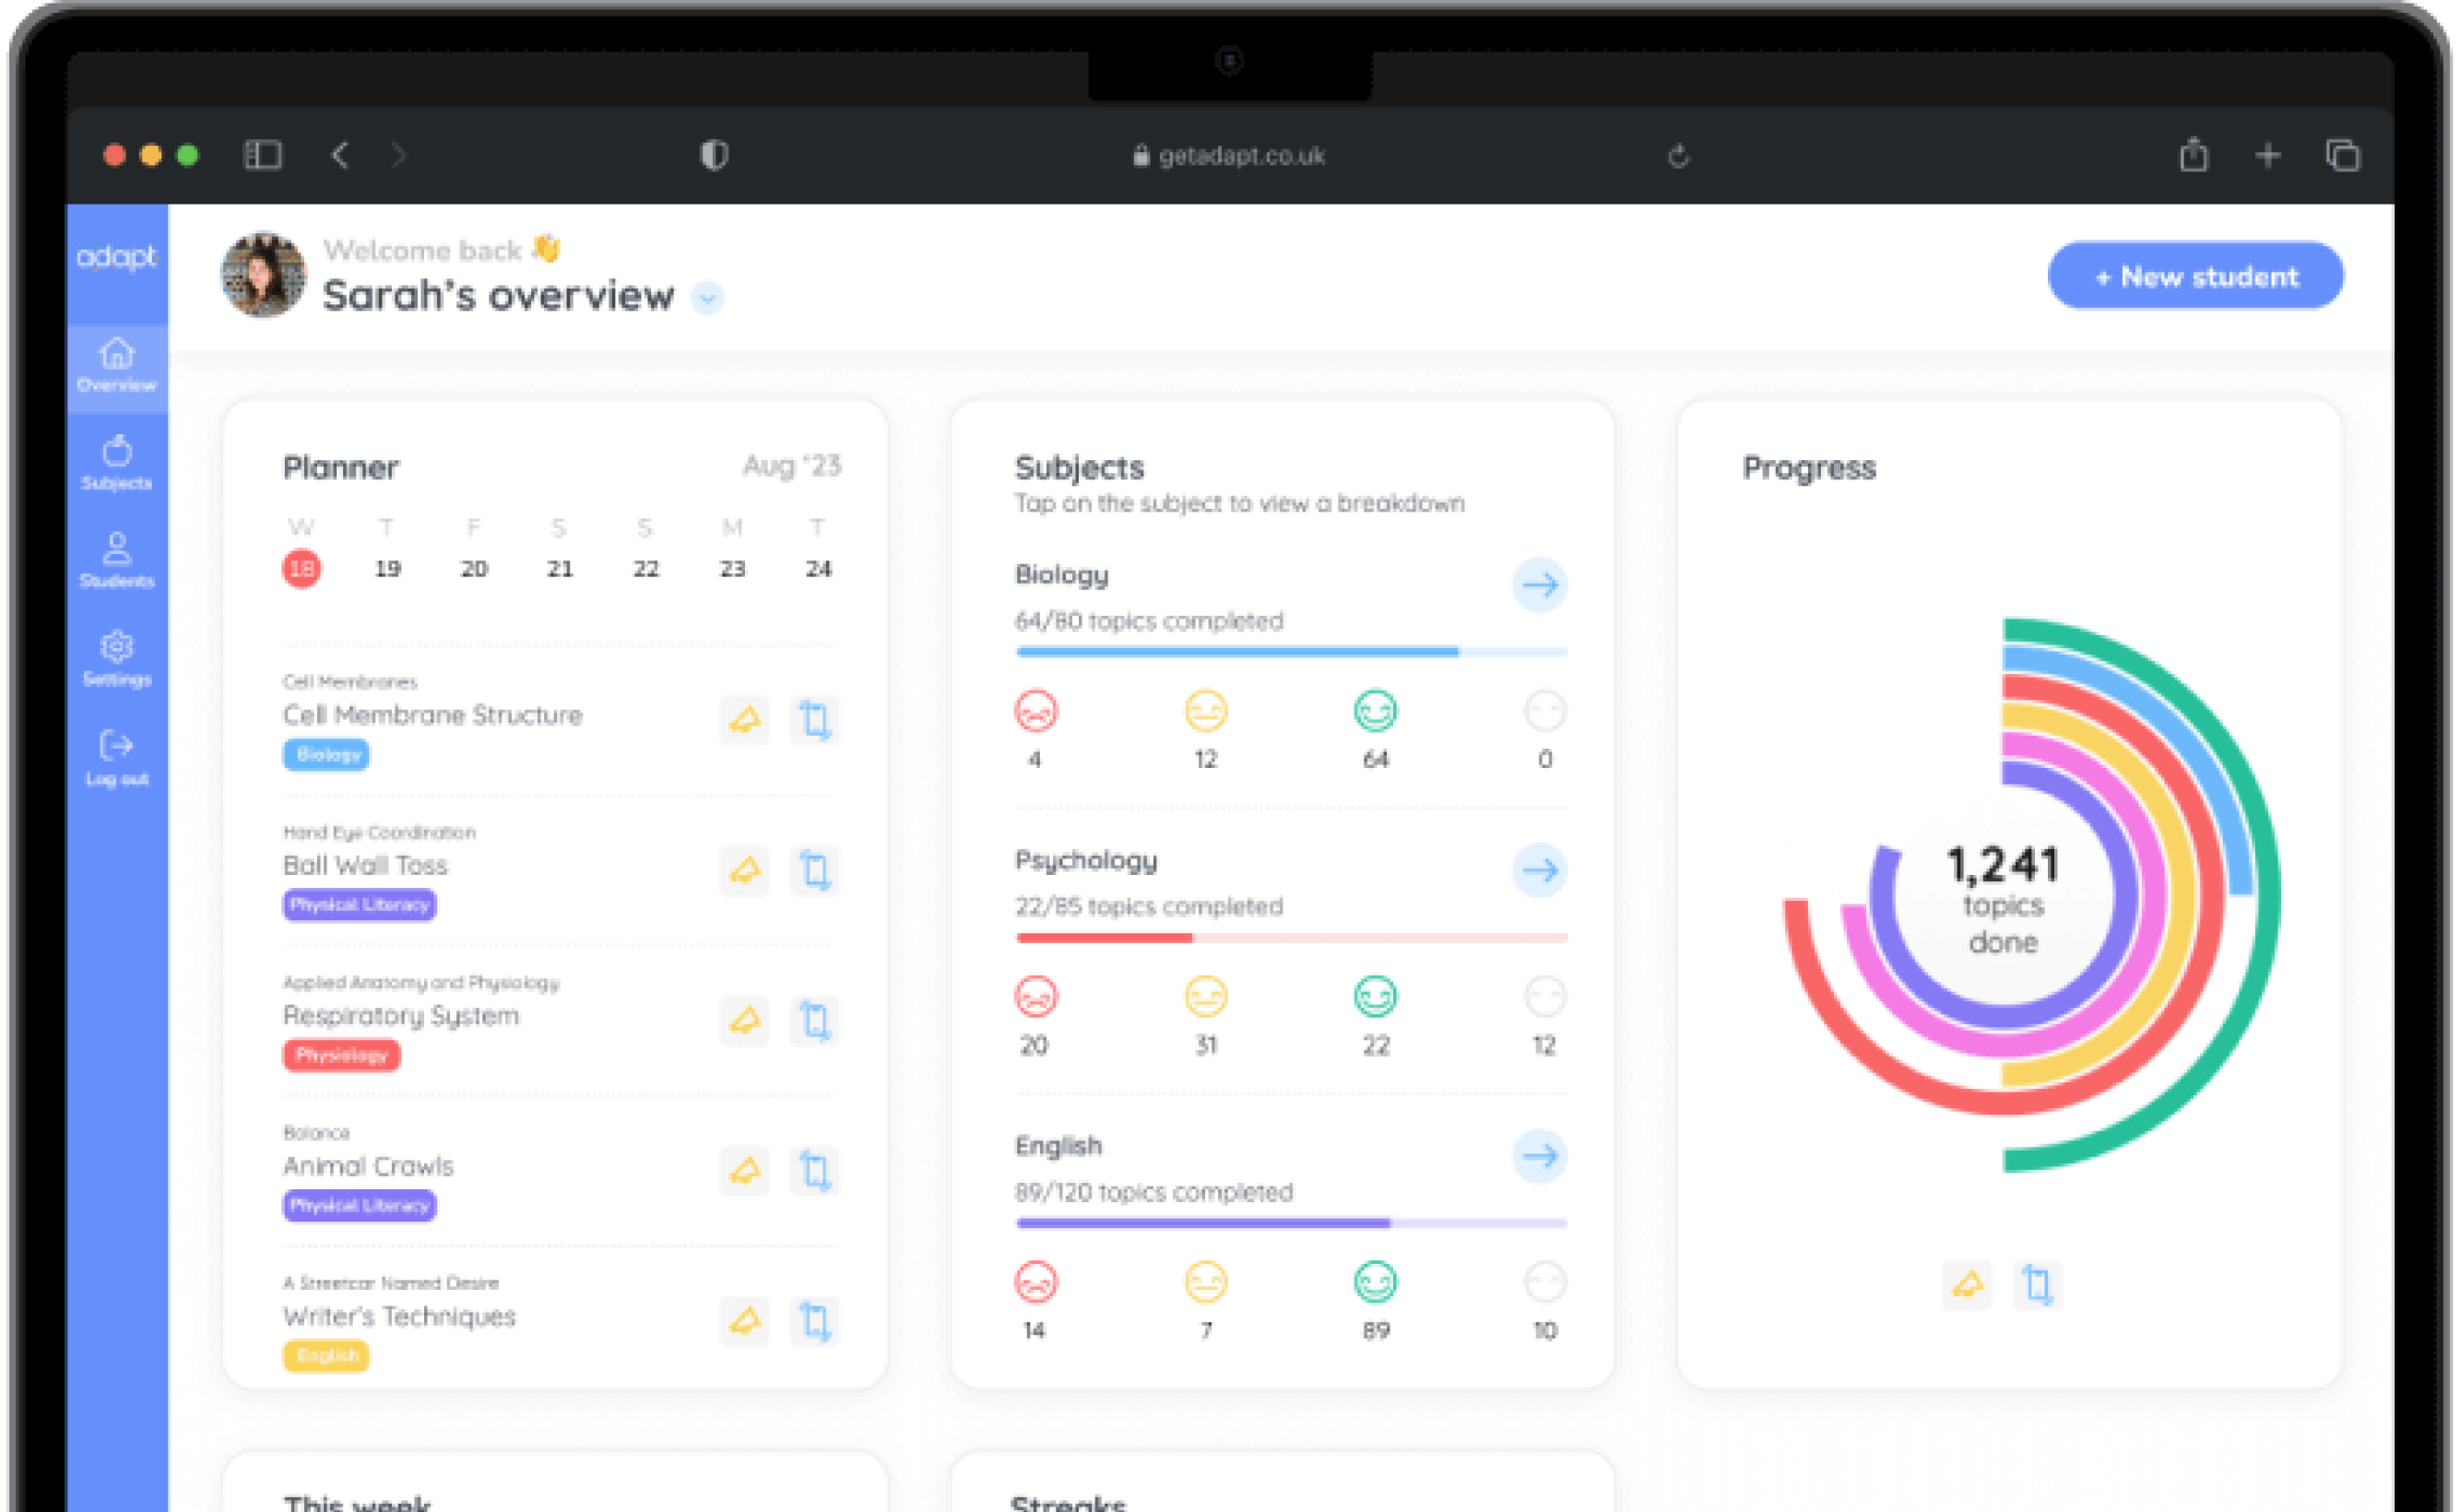
A preview of iGCSE Mathematics CAIE in the Adapt app

Adapt is a revision planning app with full content coverage and unlimited past paper questions for 1,200+ GCSE and A Level subjects.

Study this subject in the Adapt app →

Mathematics

Algebra

Algebra Basics

🤓 Study

📖 Quiz

Play audio lesson

Algebra Basics

Algebra Basics

Introduction to Algebra

  • Algebra is the part of mathematics in which variables and constants are related using numerical operations.
  • An algebraic expression is a mathematical phrase that can contain numbers, operators, and at least one variable. An example would be 2n + 3.
  • Variables are letters used to represent unspecified numbers or values.
  • Constants are items that do not change. They include numbers or set values.

Understanding Equations

  • Equations are mathematical statements that assert the equality of two expressions. Examples include 2x + 5 = 0.
  • Equating the two sides helps solve the equation to find the value of the variable.
  • Algebra requires the adaptation of the BODMAS rule. It stands for Brackets, Orders or powers, Division and Multiplication, and Addition and Subtraction.

Algebraic Operations

  • Adding or subtracting like terms is important in simplifying algebraic expressions.
  • When multiplying terms, multiply the coefficient (numerical part) and add the exponents of the variables, if they are similar.
  • When dividing terms, divide the coefficient, and subtract the exponents of the variables, if they are similar.
  • In the case of exponentiation, when the base numbers are the same, add the exponents together.

Solving Equations

  • Balancing the equation is central to solving equations. This means if you perform an operation (addition, subtraction, etc.) on one side, you must do it to the other side as well.
  • One can practise memory of algebra formulae with the Quadratic Formula which is used to solve quadratic equations: x = [ -b ± sqrt(b^2 - 4ac) ] / 2a

Factorising and Expanding

  • Factorising involves writing the given terms as a product of their factors.
  • Expanding is the process of removing the brackets from an algebraic expression.

Linear and Quadratic Equations

  • Linear equations in a single variable are ones where the variable has an exponent of "1", which is typically not shown (e.g., x + 2 = 0).
  • Quadratic equations appear in the format of ax^2 + bx + c = 0, a ≠ 0. Solutions can be real or complex which can be found using a variety of methods such as factorisation, completing the square, or using the quadratic formula.

Remember, practising these fundamentals regularly will sharpen your algebraic skills and boost your problem-solving ability.

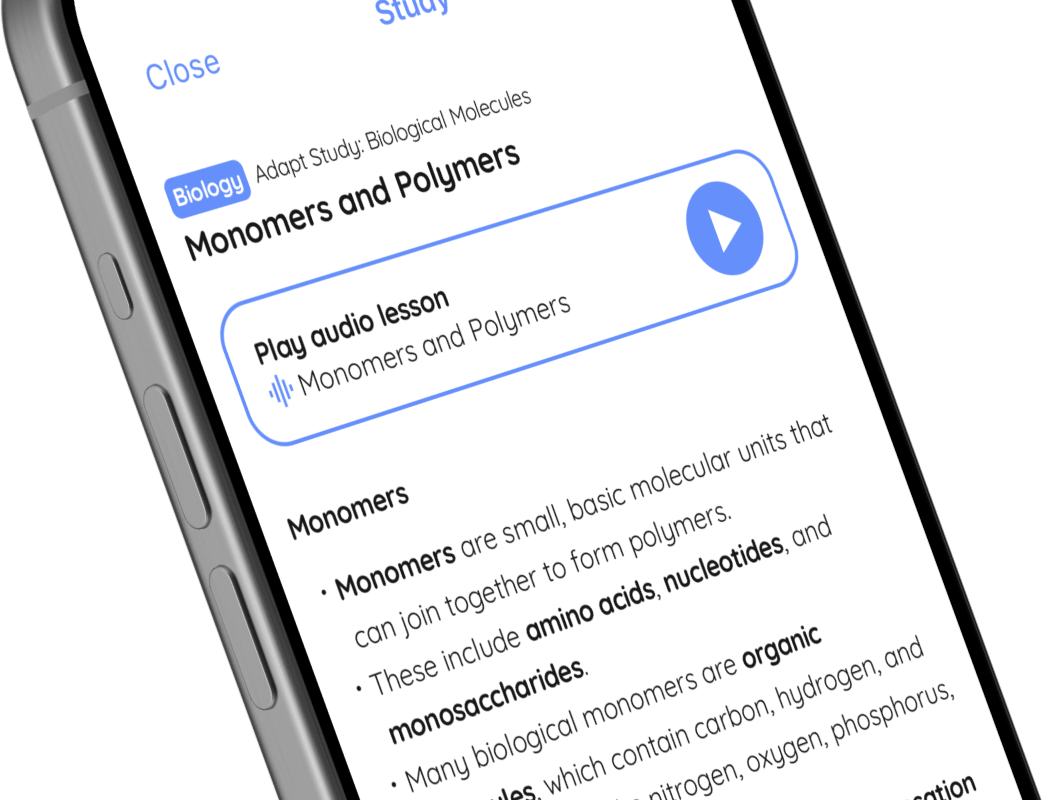
Course material for Mathematics, module Algebra, topic Algebra Basics

Mathematics

Graphs, Functions and Calculus

Real-Life Graphs

🤓 Study

📖 Quiz

Play audio lesson

Real-Life Graphs

Understanding Real-Life Graphs

  • Real-life graphs or practical charts are a way to represent real-world situations.
  • Graphs can be a powerful tool for visualising and analysing data in numerous fields, including science, economics, and social studies.
  • Different graph types are useful for different situations. For instance, line graphs can demonstrate change over time, while bar graphs can compare different groups.

Interpreting Real-Life Graphs

  • The x-axis (horizontal) typically represents time in real-life graphs, but not always - be aware of what each axis signifies.
  • The y-axis (vertical) typically represents the quantity or amount.
  • Intercepts indicates where the data crosses the x or y axis, and they can be specifically crucial for certain real-life scenarios.
  • When reading a graph, it's important to understand what each point signifies, what trends are evident, and what possible predictions might be made.

Drawing Real-Life Graphs

  • To draw a real-life graph, you first need to determine what variables you're comparing.
  • Next, establish a scale for the x and y axis. The scale should be appropriate for the data you're graphing.
  • Plot the data points accurately and then connect them based on the type of graph being created.
  • Don't forget to label each axis and provide a clear title for the graph.

Analysing Real-Life Graphs

  • To analyse real-life graphs, look for trends or patterns. These could be a consistent increase, decrease, or a cycle.
  • Anomalies, or deviant points from the established pattern, can be telling of exceptional events or errors in data.
  • Correlations can indicate a relationship between two variables. If the graph depicts a clear uphill pattern from left to right, it means there's a positive correlation.

Applying Concepts of Real-Life Graphs

  • Concepts of real-life graphs are used widely in statistics, physics, business, and even in health sciences.
  • They can be used to represent change over time, distribution of data, and to make predictions off collected data.
  • Real-world applications include representing population growth, climate change data, stock market trends or even tracking a person's health progress.

Course material for Mathematics, module Graphs, Functions and Calculus, topic Real-Life Graphs

Can I trust Adapt’s expertise?

Adapt is already used by over 600,000 students and trusted by over 3,000 schools. Our exam-specific content and assessments are meticulously crafted by expert teachers and examiners.

Find out more about the Adapt app →

Planner

An always up-to-date revision timetable.

A personalised, flexible revision timetable that stays up-to-date automatically.

Content

All the exam resources, in one place.

Over 20,000 topics broken down into manageable lessons with teacher-written, exam-specific lessons.

Assessment

Past-paper questions, with instant feedback.

Unlimited past paper questions with instant examiner feedback on how to improve.

Progress

Track progress, together.

Progress tracking to stay motivated, with real-time updates to the Parent Portal.

Download the app today to start revising for free.